3 slides

Orientation

  1. Session 3.5 title slide: Working with Data in Excel.

    Slide 1

    Working With Data in Excel

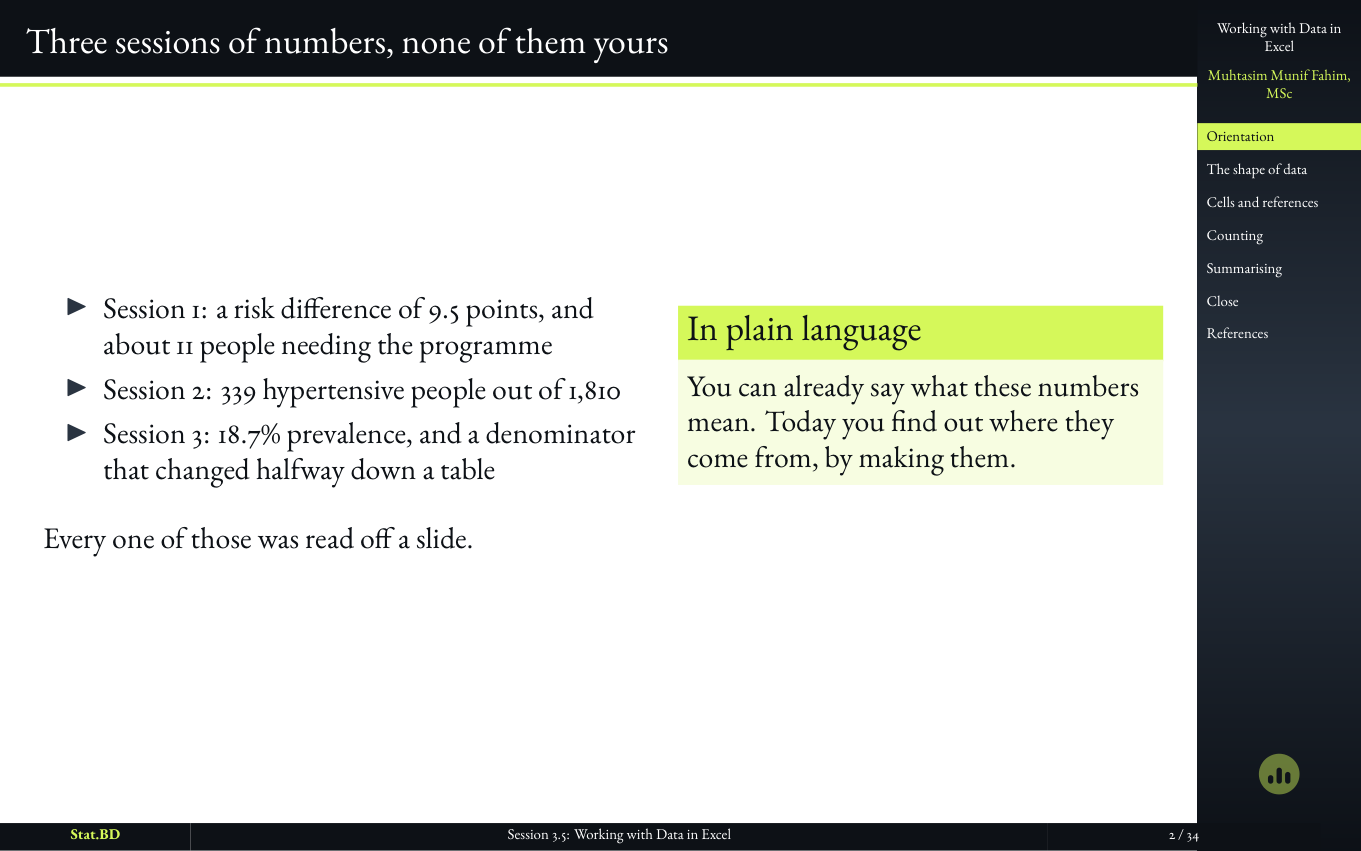
  2. Slide stating that three sessions of numbers had been shown but none produced by the student.

    Slide 2

    Three sessions of numbers, none of them yours

    The risk difference, the hypertensive counts, the percentages: all printed, none typed. A mentorship plan that cannot insert a lab here is a syllabus, not a room.

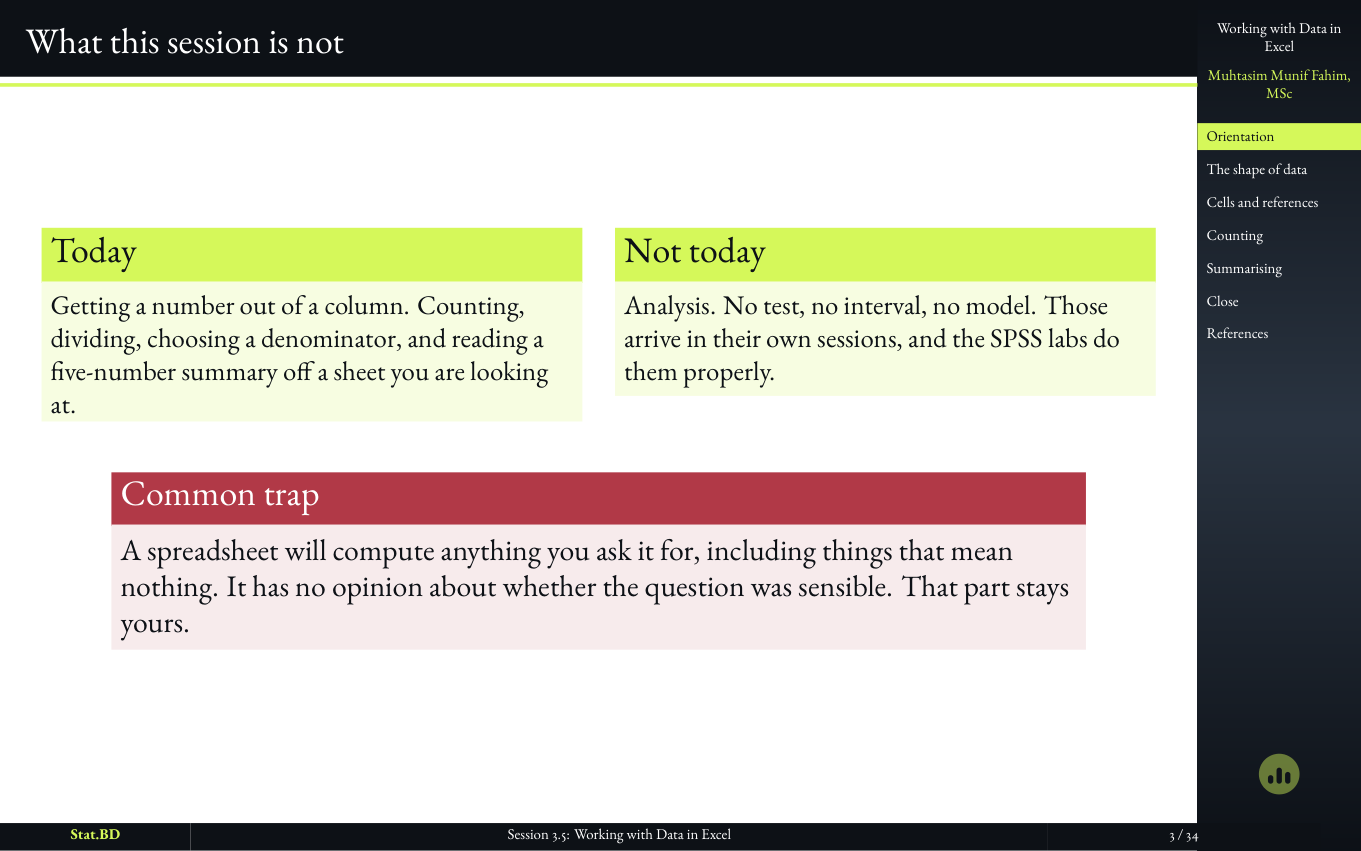
  3. Slide stating what the Excel session is not.

    Slide 3

    What this session is not

    It is not an Excel course. It is not a new paper. It is the earlier numbers, made rather than received, so the next session can talk about means and medians with a student who has already produced both.

7 slides

Act I · A Sheet Is a Dataset, Not a Report

  1. Session 3.5, Act I · A sheet is a dataset, not a report: Act I · A sheet is a dataset, not a report.

    Slide 4

    Act I · A Sheet Is a Dataset, Not a Report
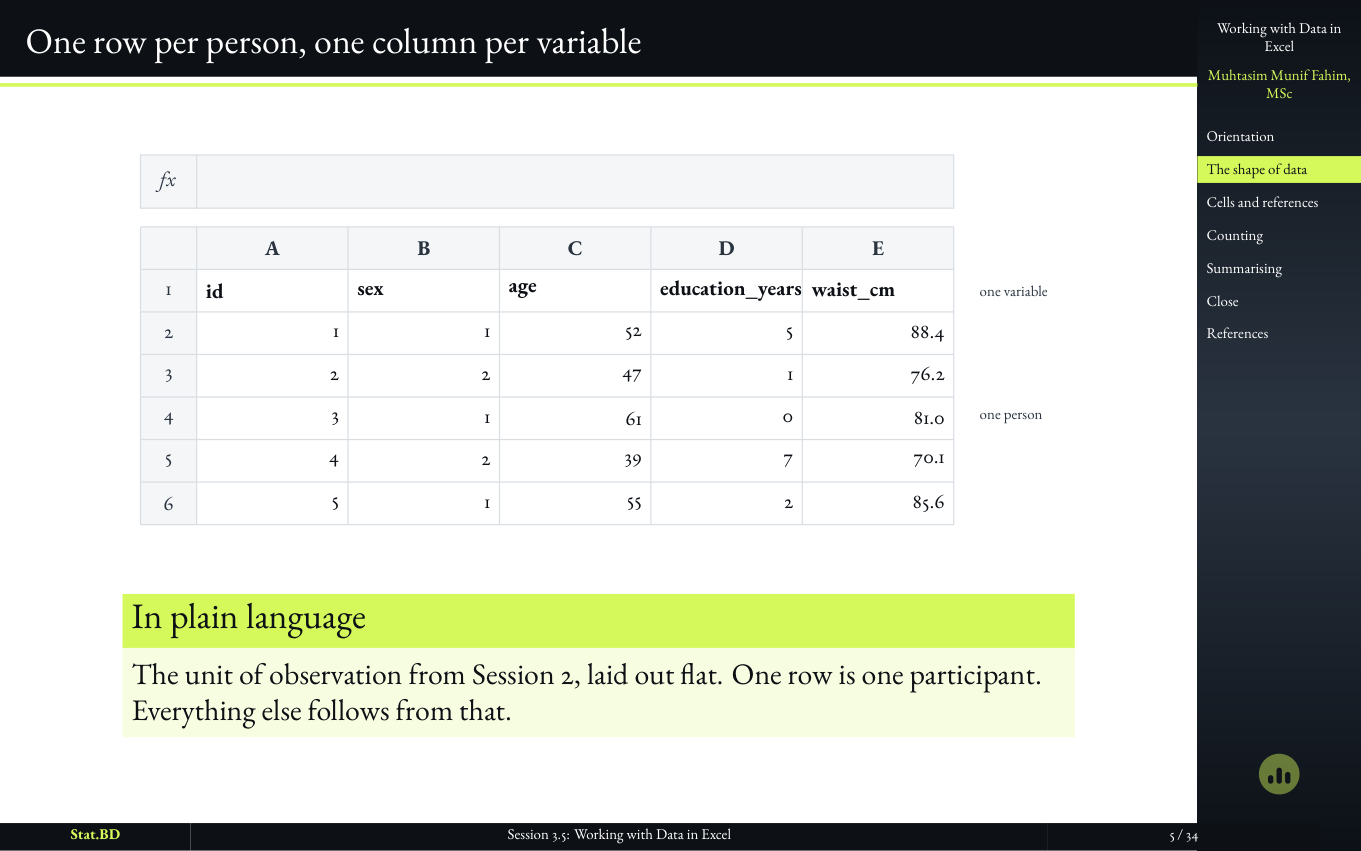
  2. Slide stating the rule of one row per person and one column per variable.

    Slide 5

    One row per person, one column per variable

    Session 2’s rectangle becomes a sheet. If that rule is broken, every later formula is decorating a mess.

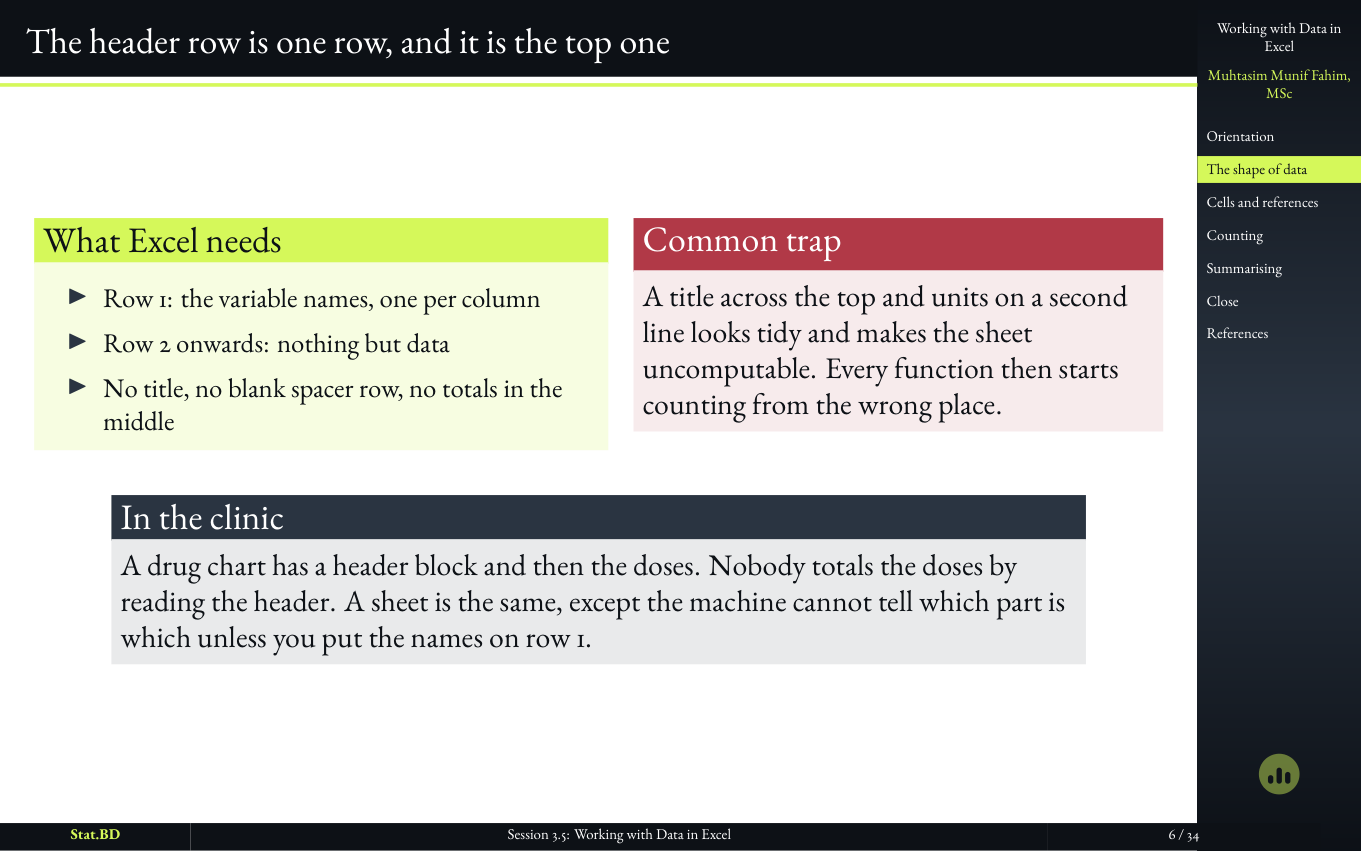
  3. Session 3.5, Act I · A sheet is a dataset, not a report: The header row is one row, and it is the top one.

    Slide 6

    The header row is one row, and it is the top one

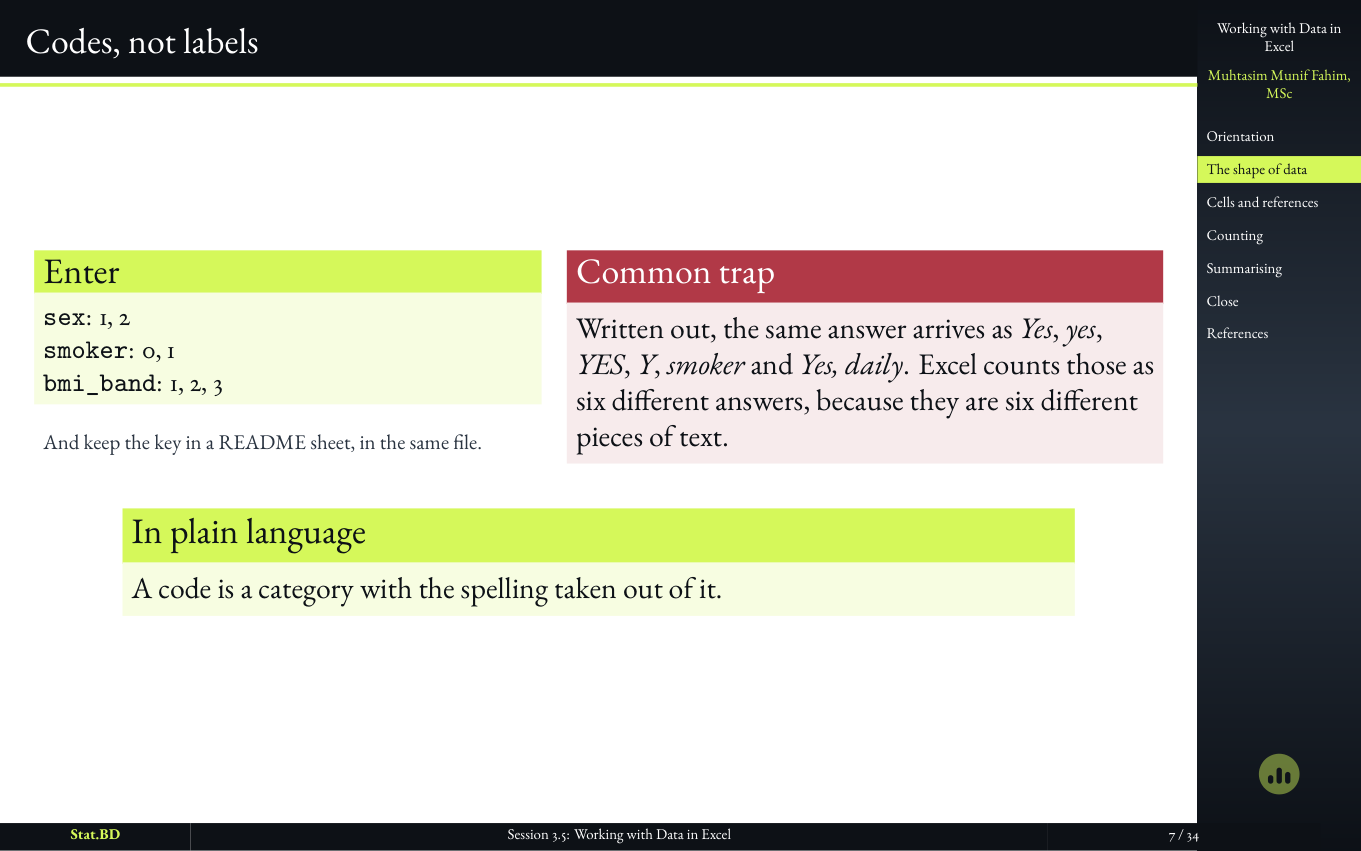
  4. Session 3.5, Act I · A sheet is a dataset, not a report: Codes, not labels.

    Slide 7

    Codes, not labels

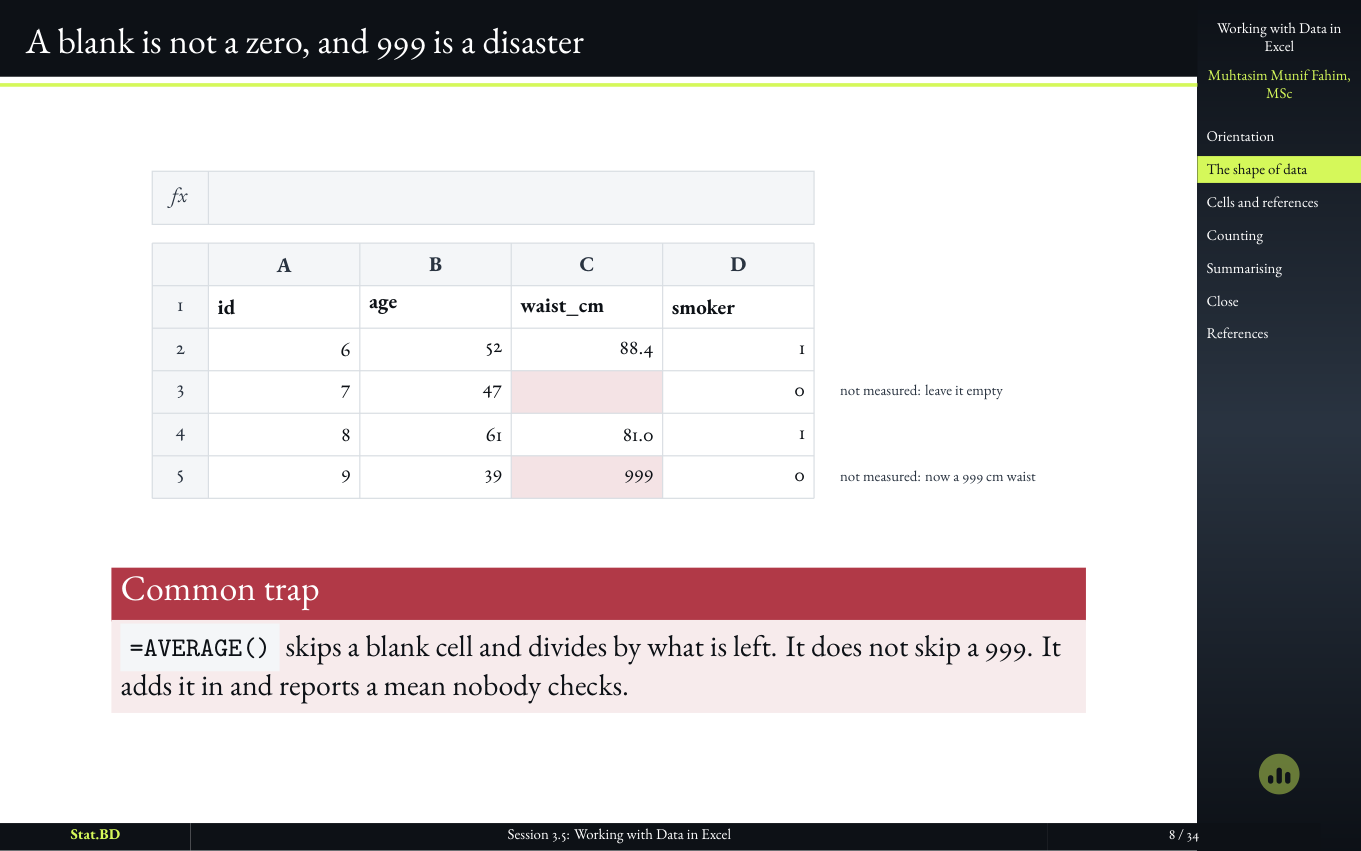
  5. Slide warning that a blank is not a zero and that 999 as a missing code is a disaster.

    Slide 8

    A blank is not a zero, and 999 is a disaster

    Missingness is a decision that has to stay visible. Filling it with zero invents patients. Coding it as 999 invents giants. Both destroy a mean before anyone has chosen a test.

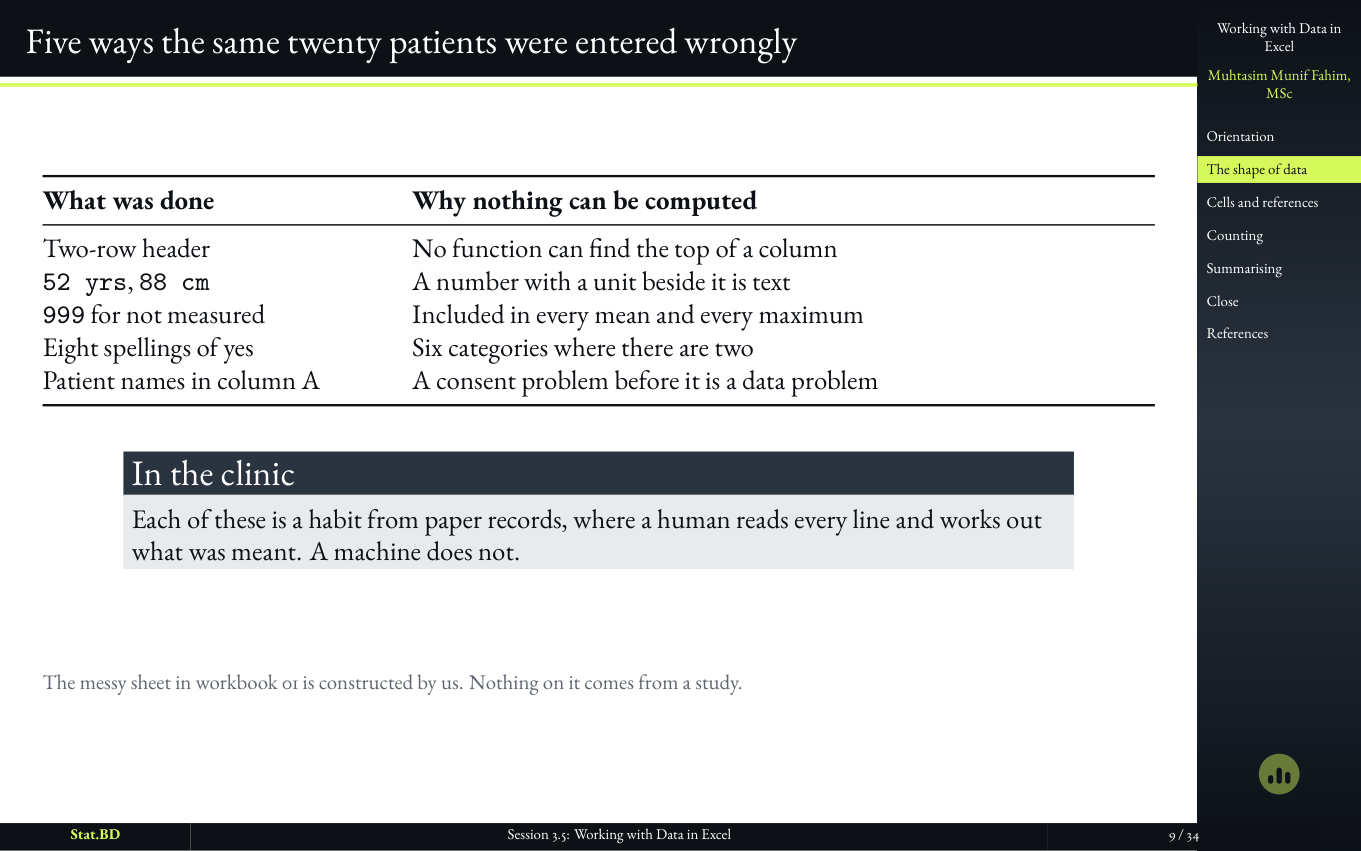
  6. Slide showing five ways the same twenty patients were entered wrongly.

    Slide 9

    Five ways the same twenty patients were entered wrongly

    The practice register is simulated and says so on the frame. The mistakes are not. They are the ones that quietly sit under a finished Table 1.

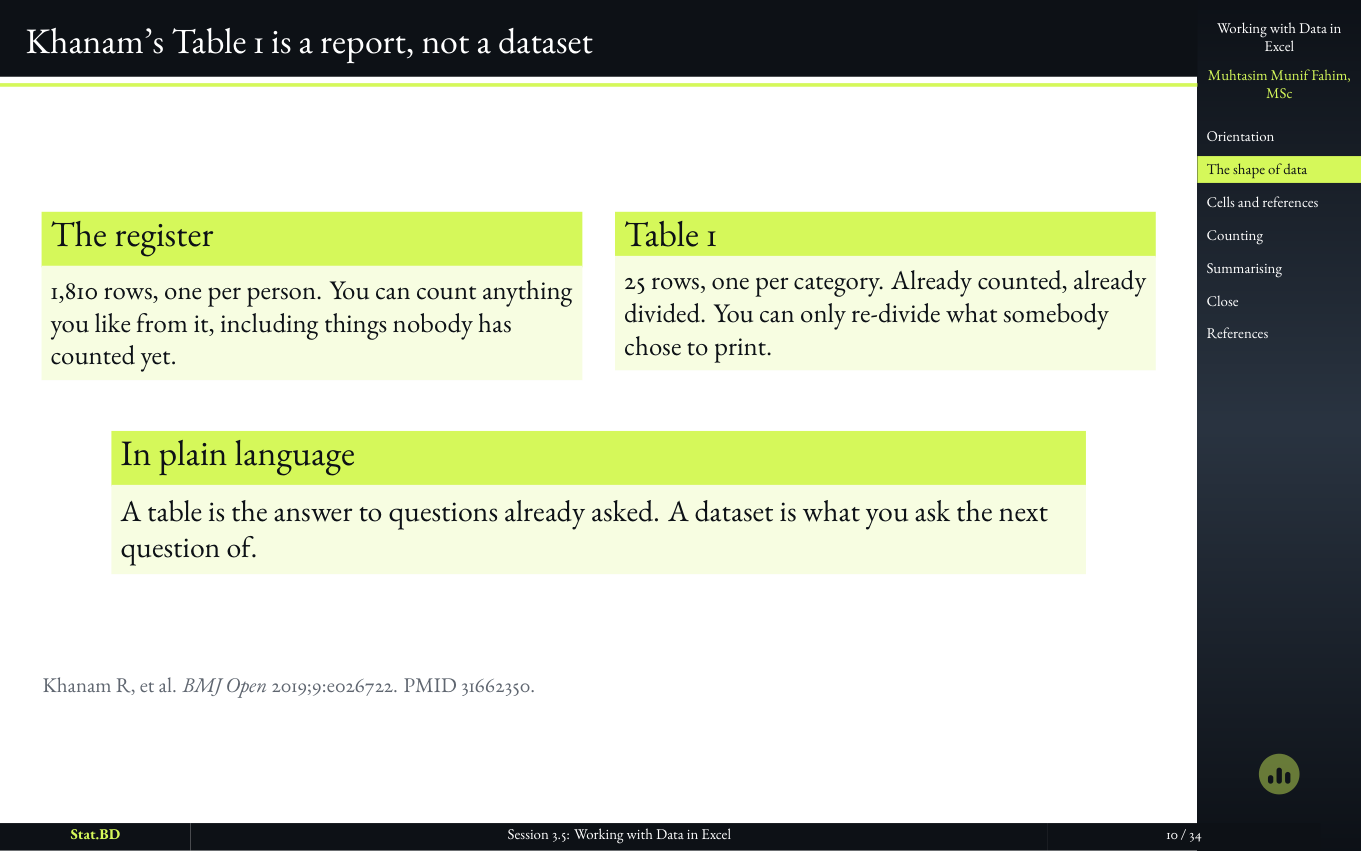
  7. Slide contrasting a patient register with a published Table 1.

    Slide 10

    Khanam’s Table 1 is a report, not a dataset

    A table is the answer to questions already asked. A dataset is what you ask the next question of. Confusing the two is how people try to ‘analyze’ a published table and think they have the study.

7 slides

Act II · Addresses, Formulas, and the Denominator That Moved
  1. Session 3.5, Act II · Addresses, formulas, and the denominator that moved: Act II · Addresses, formulas, and the denominator that moved.

    Slide 11

    Act II · Addresses, Formulas, and the Denominator That Moved
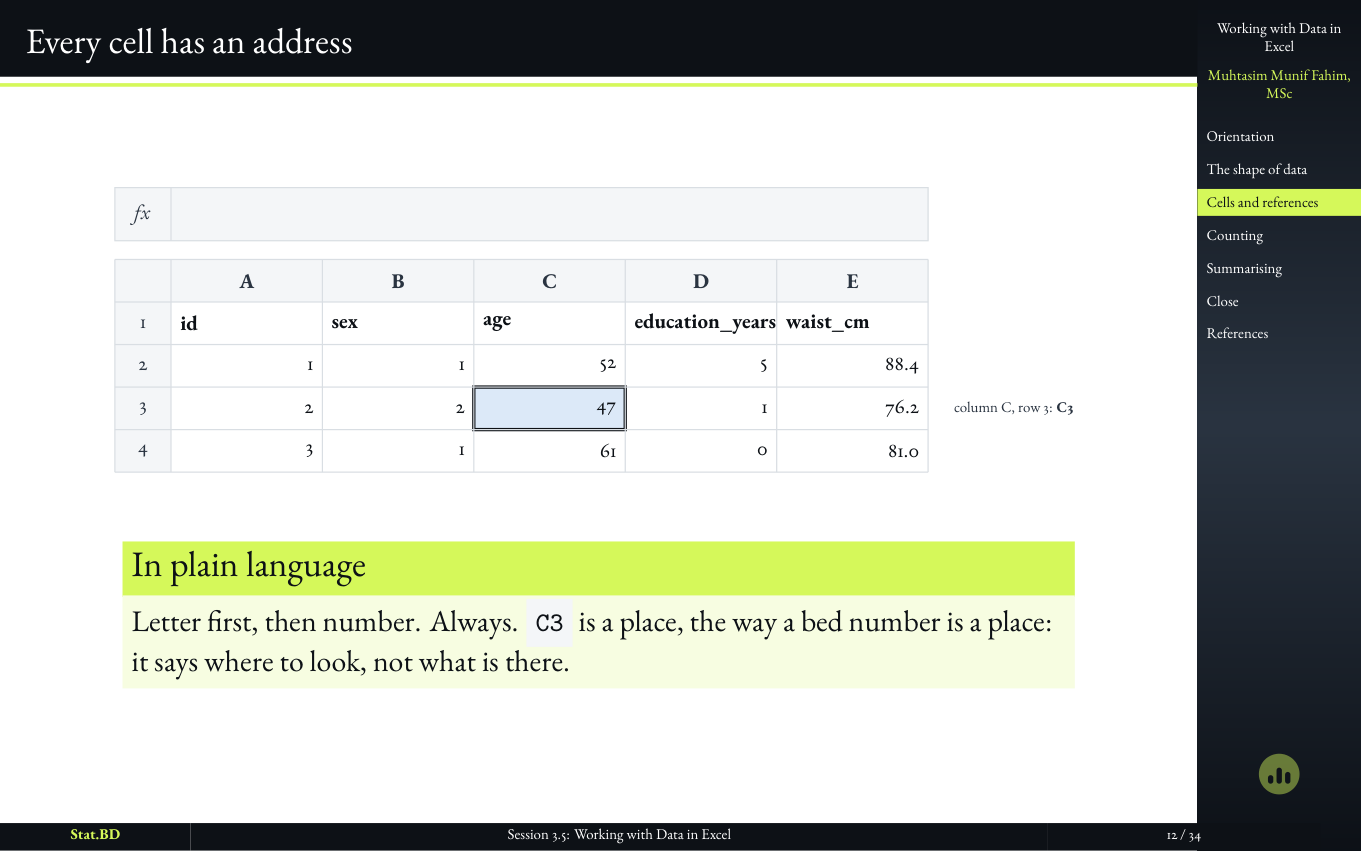
  2. Session 3.5, Act II · Addresses, formulas, and the denominator that moved: Every cell has an address.

    Slide 12

    Every cell has an address

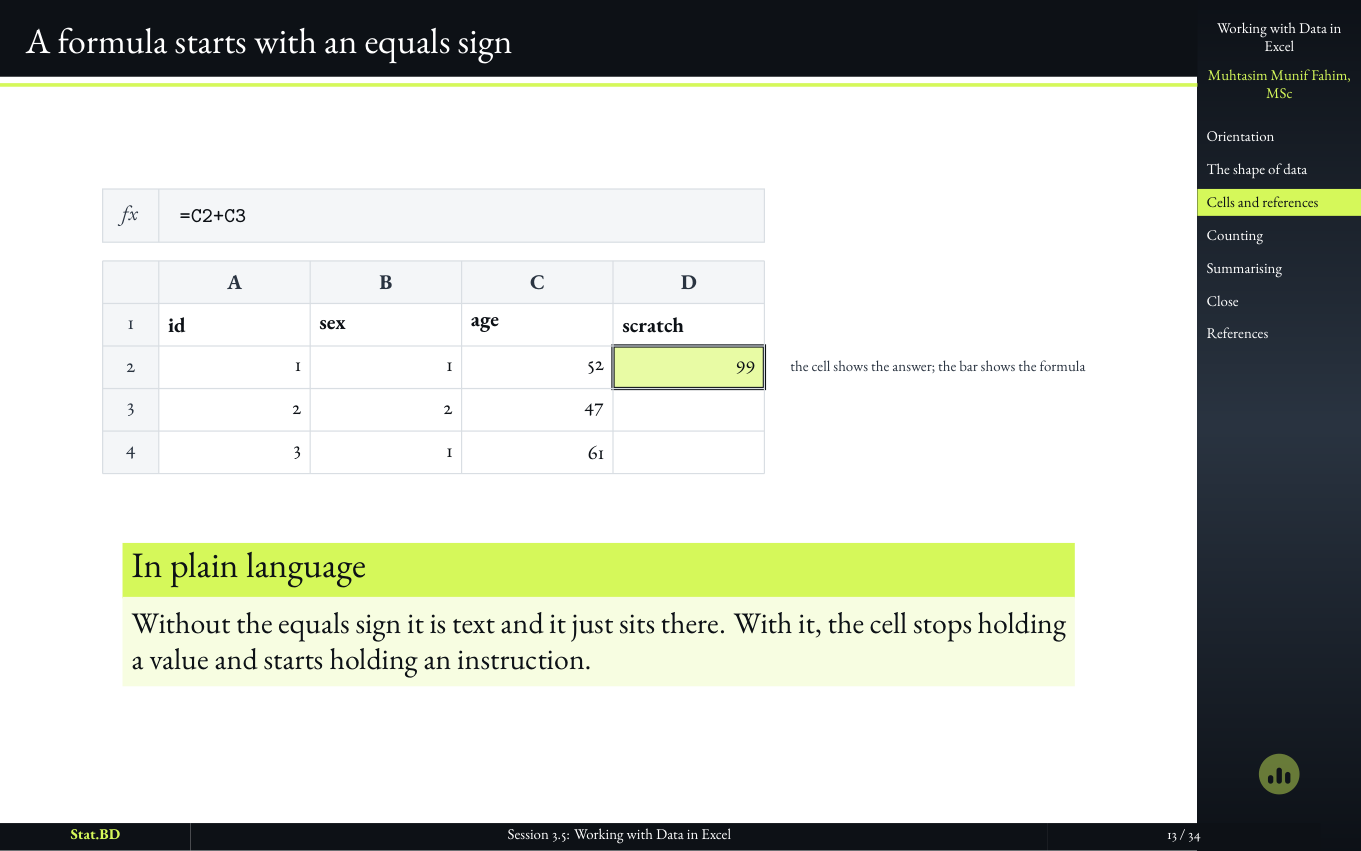
  3. Session 3.5, Act II · Addresses, formulas, and the denominator that moved: A formula starts with an equals sign.

    Slide 13

    A formula starts with an equals sign

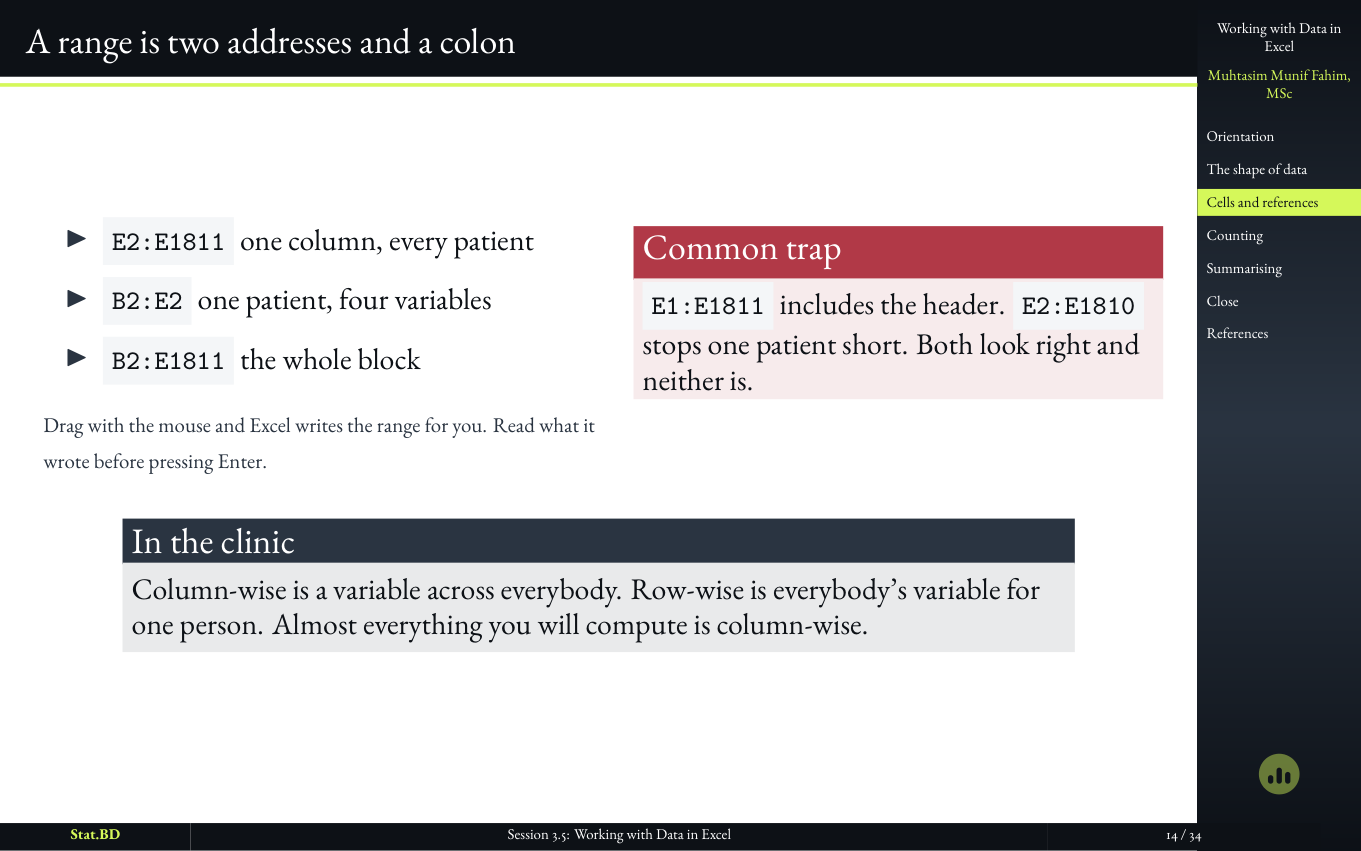
  4. Session 3.5, Act II · Addresses, formulas, and the denominator that moved: A range is two addresses and a colon.

    Slide 14

    A range is two addresses and a colon

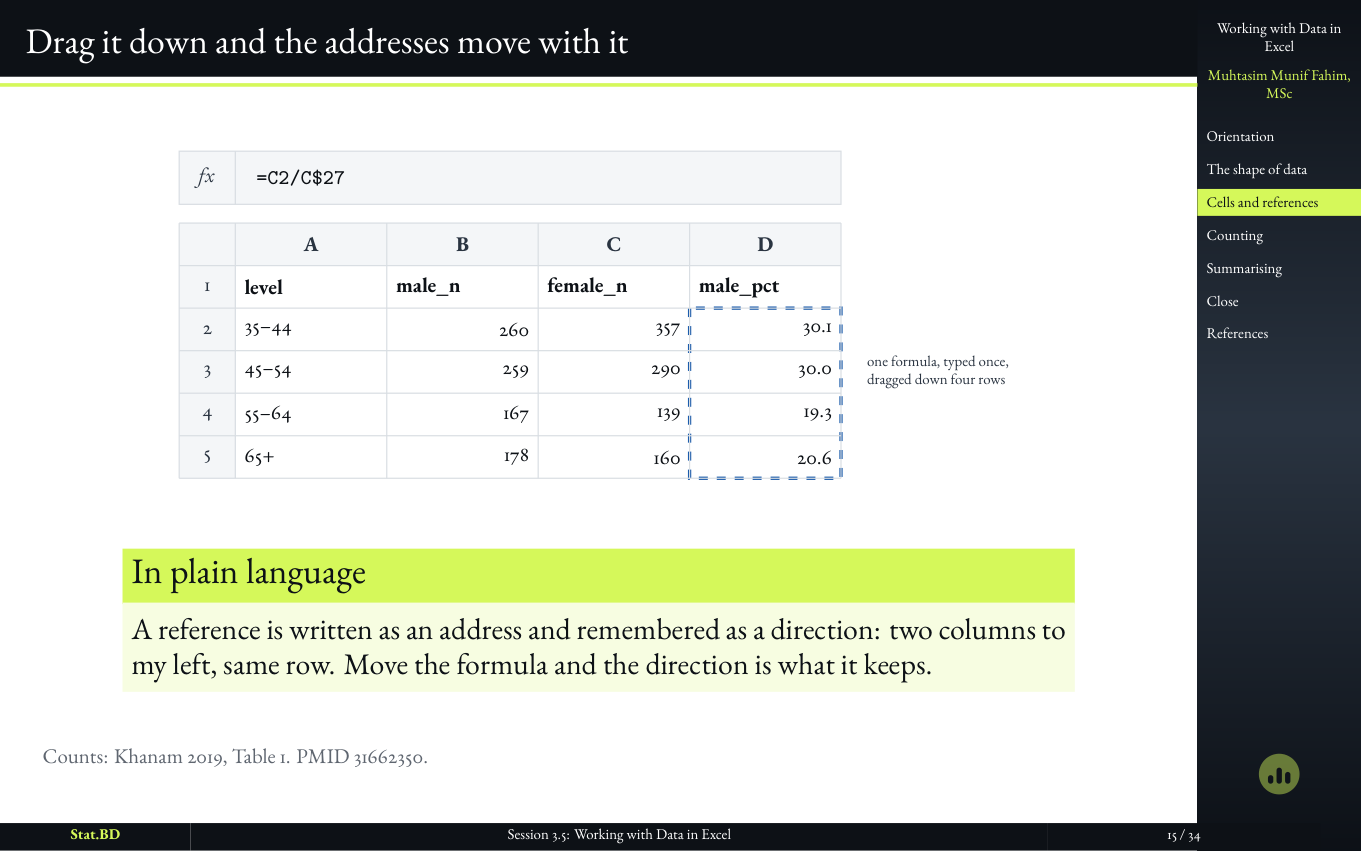
  5. Session 3.5, Act II · Addresses, formulas, and the denominator that moved: Drag it down and the addresses move with it.

    Slide 15

    Drag it down and the addresses move with it

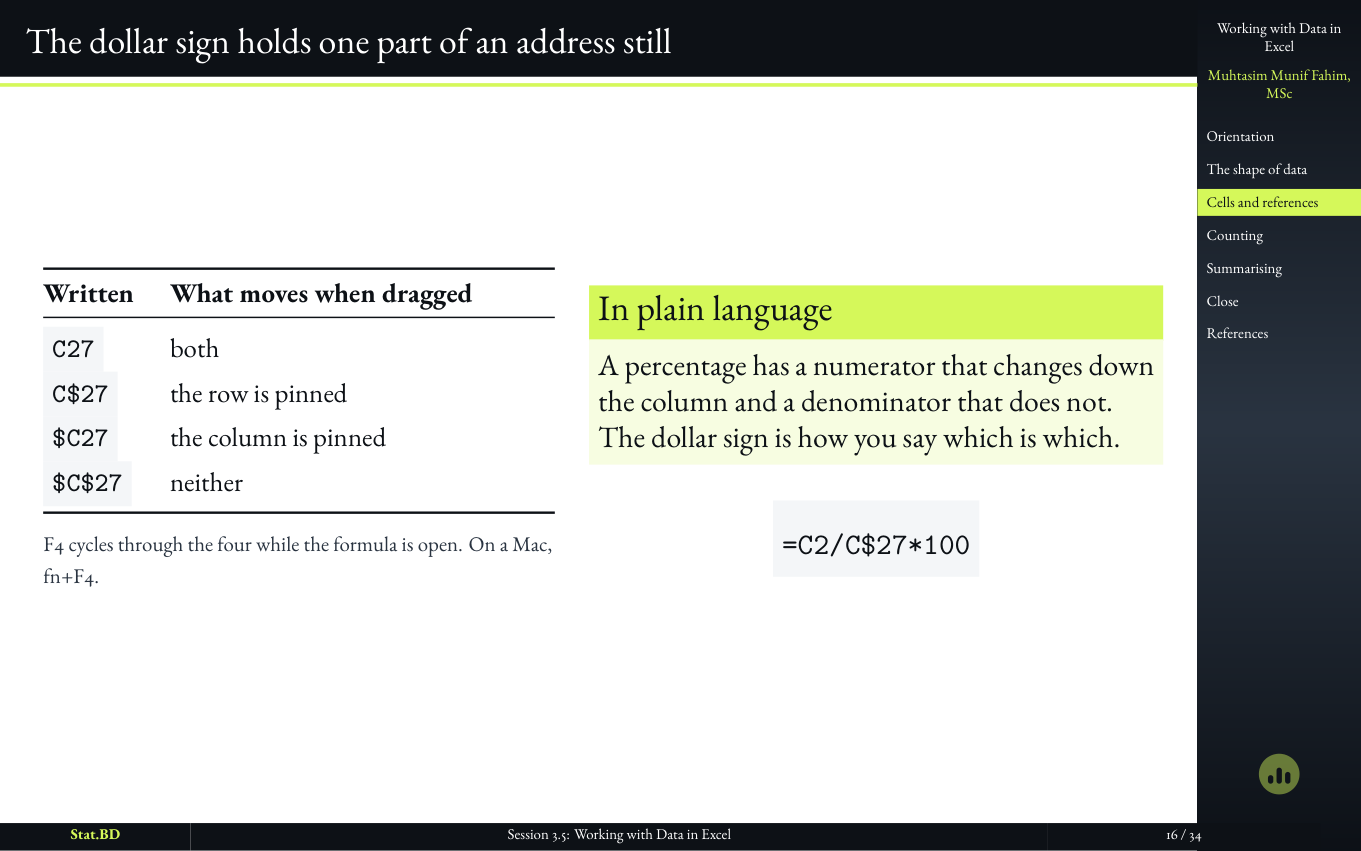
  6. Session 3.5, Act II · Addresses, formulas, and the denominator that moved: The dollar sign holds one part of an address still.

    Slide 16

    The dollar sign holds one part of an address still

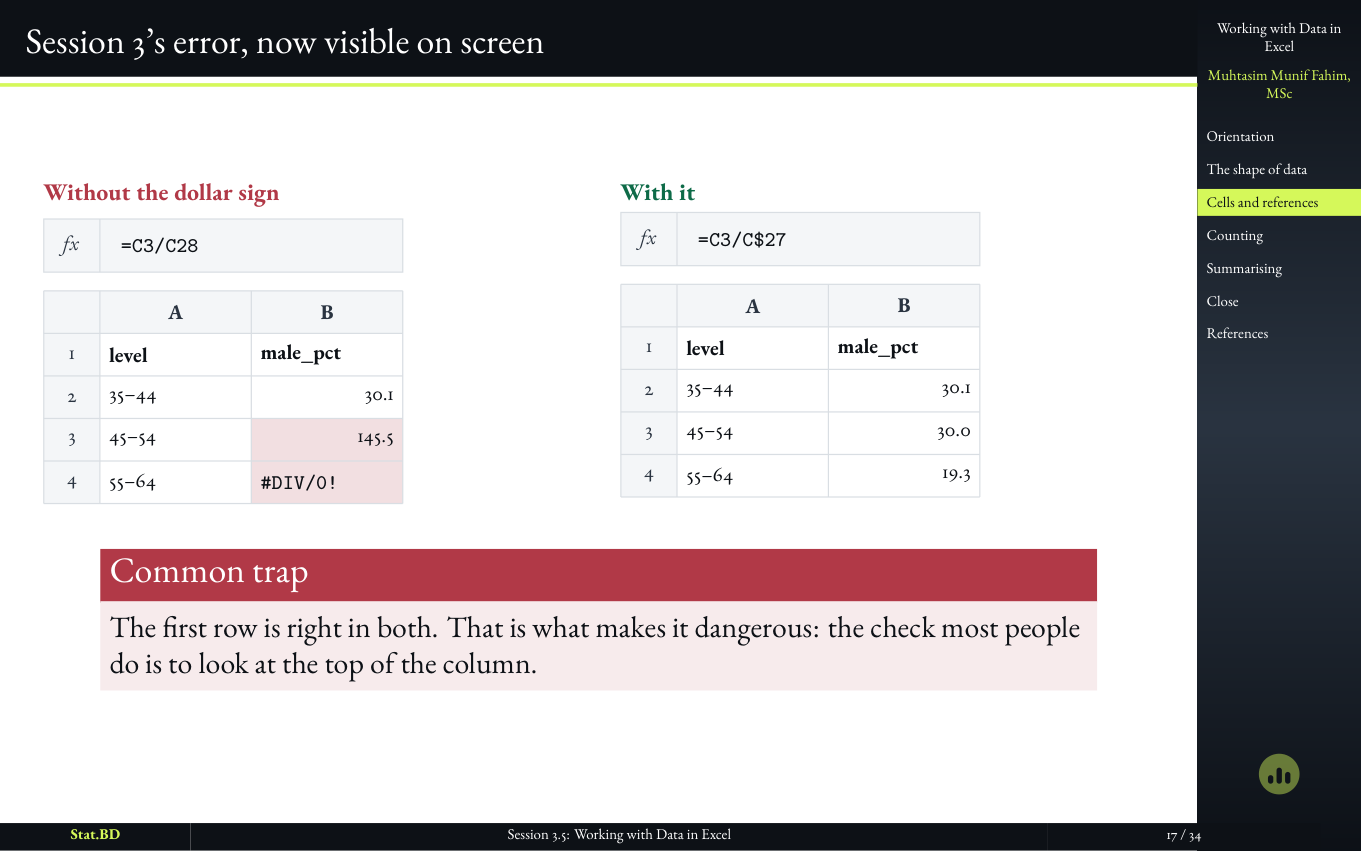
  7. Session 3.5, Act II · Addresses, formulas, and the denominator that moved: Session 3’s error, now visible on screen.

    Slide 17

    Session 3’s error, now visible on screen

8 slides

Act III · Counting a Categorical Column

  1. Session 3.5, Act III · Counting a categorical column: Act III · Counting a categorical column.

    Slide 18

    Act III · Counting a Categorical Column
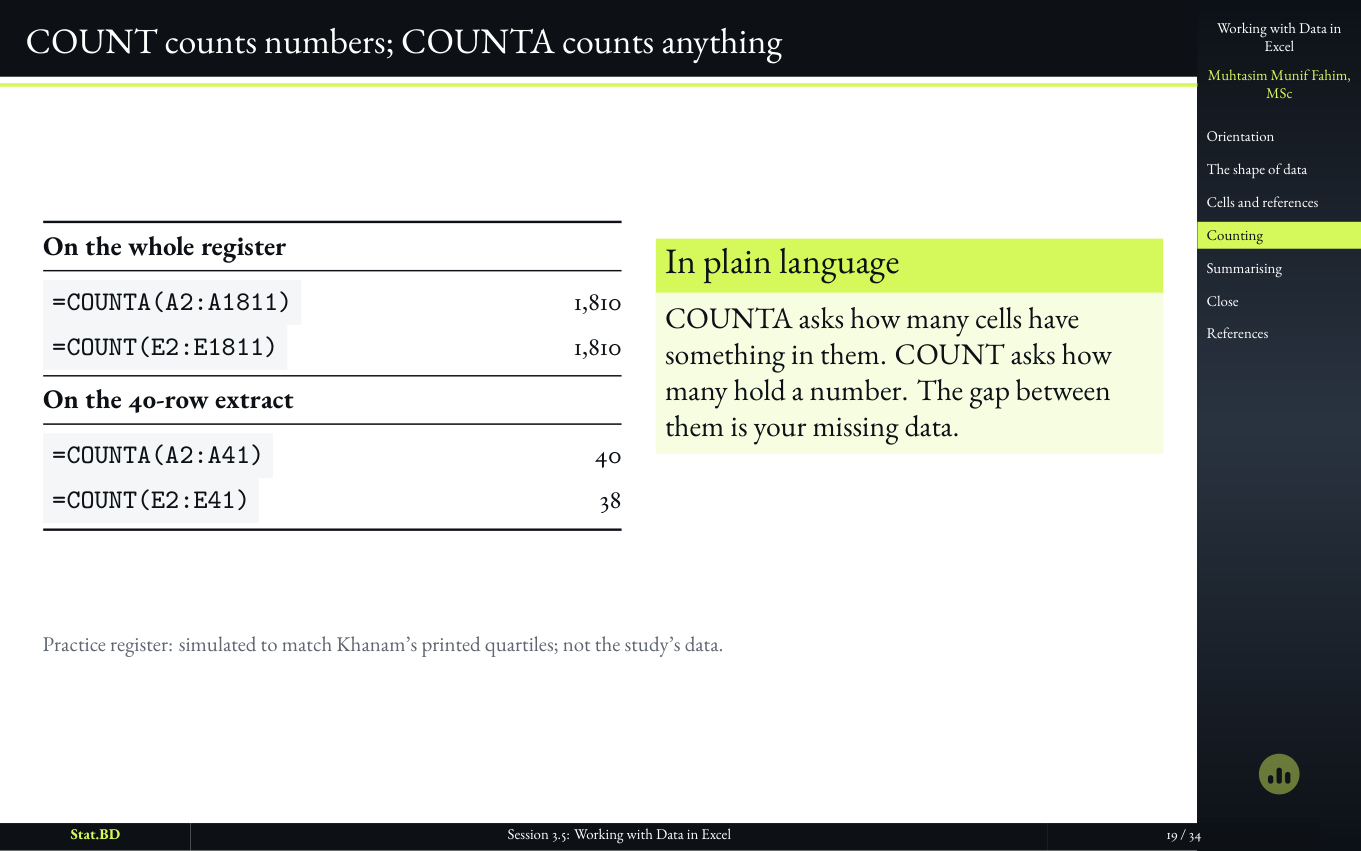
  2. Session 3.5, Act III · Counting a categorical column: COUNT counts numbers; COUNTA counts anything.

    Slide 19

    COUNT counts numbers; COUNTA counts anything

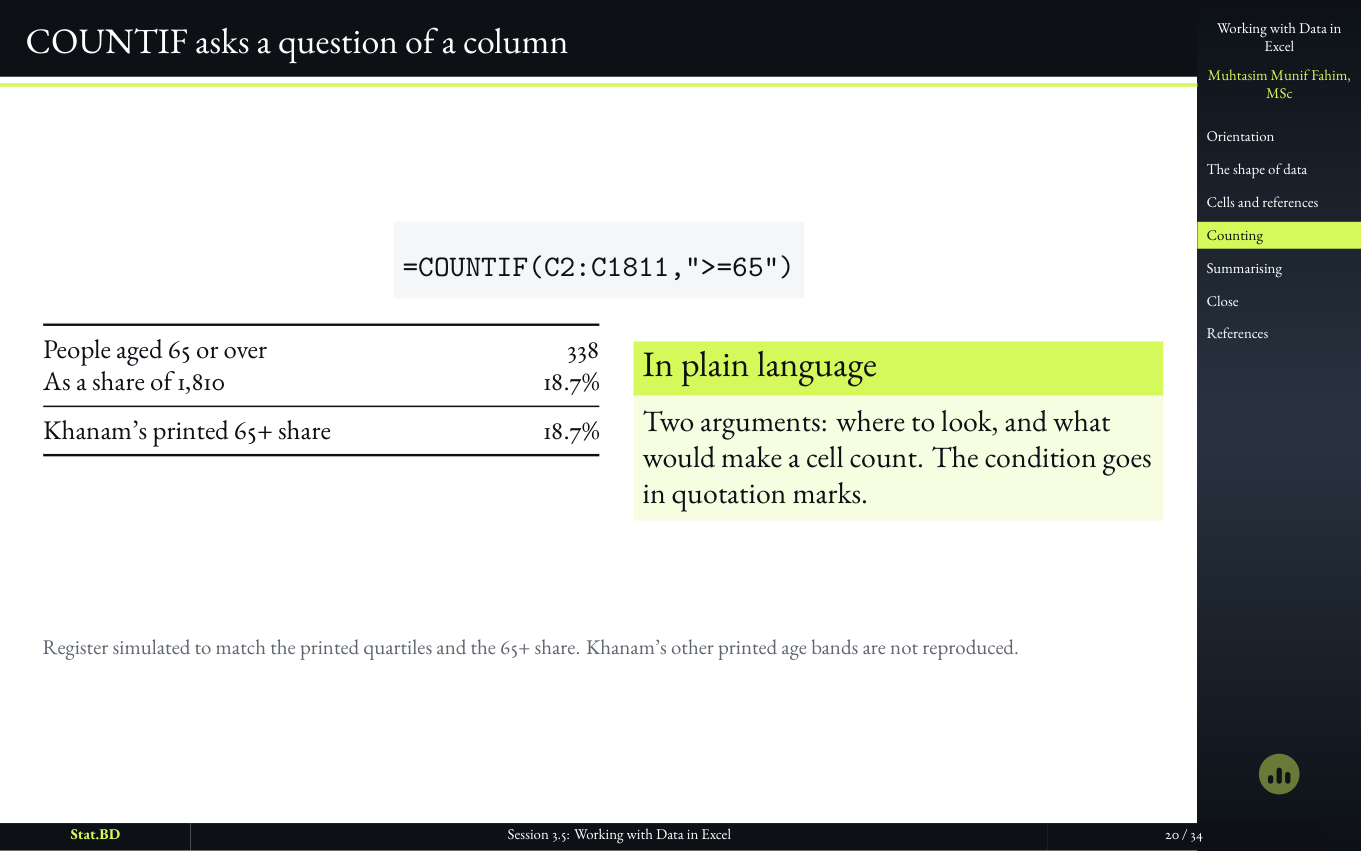
  3. Session 3.5, Act III · Counting a categorical column: COUNTIF asks a question of a column.

    Slide 20

    COUNTIF asks a question of a column

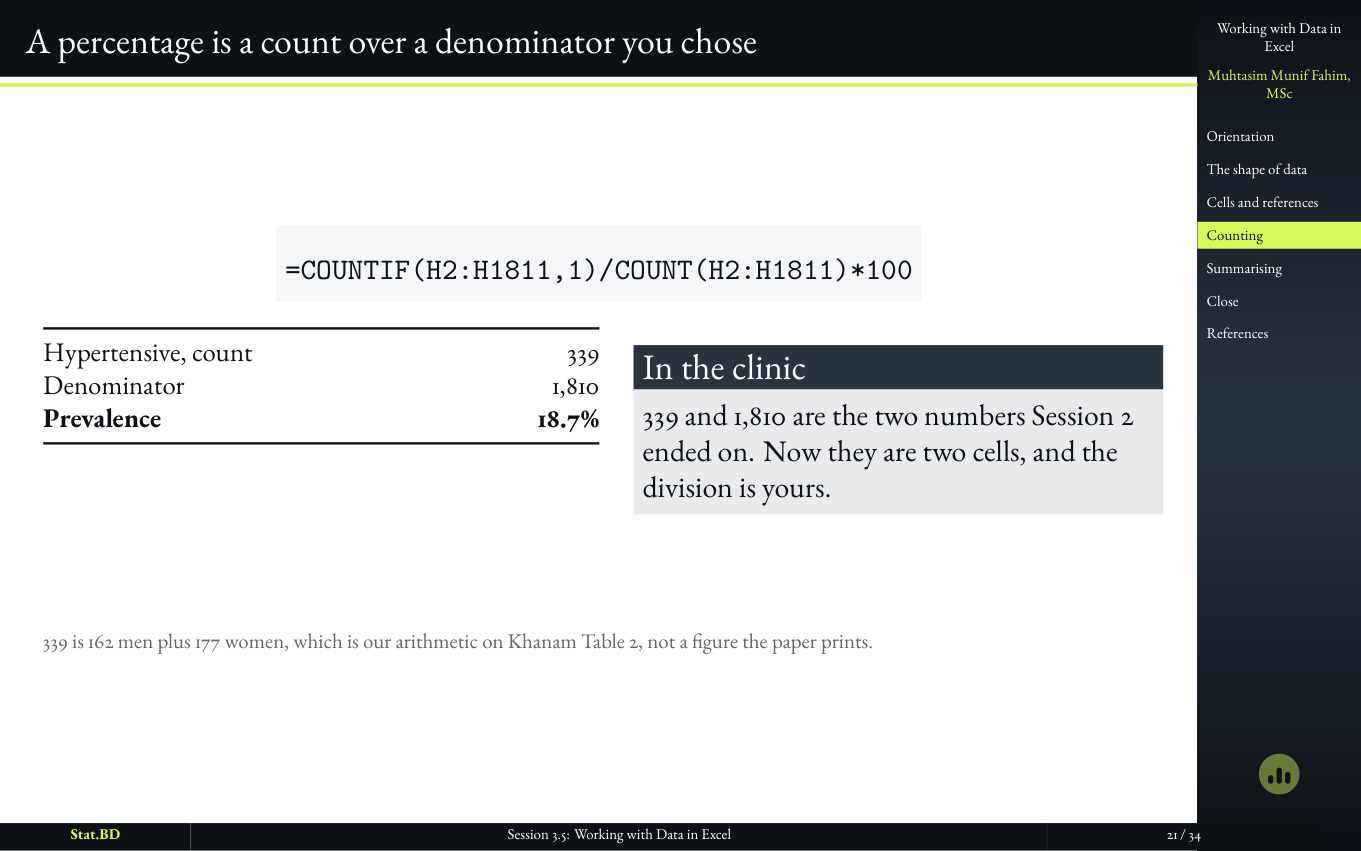
  4. Slide showing a percentage as a count over a denominator the analyst chose.

    Slide 21

    A percentage is a count over a denominator you chose

    Session 3’s sentence becomes a formula. The denominator is still a choice. Excel will not make it for you; it will only remember the choice you typed.

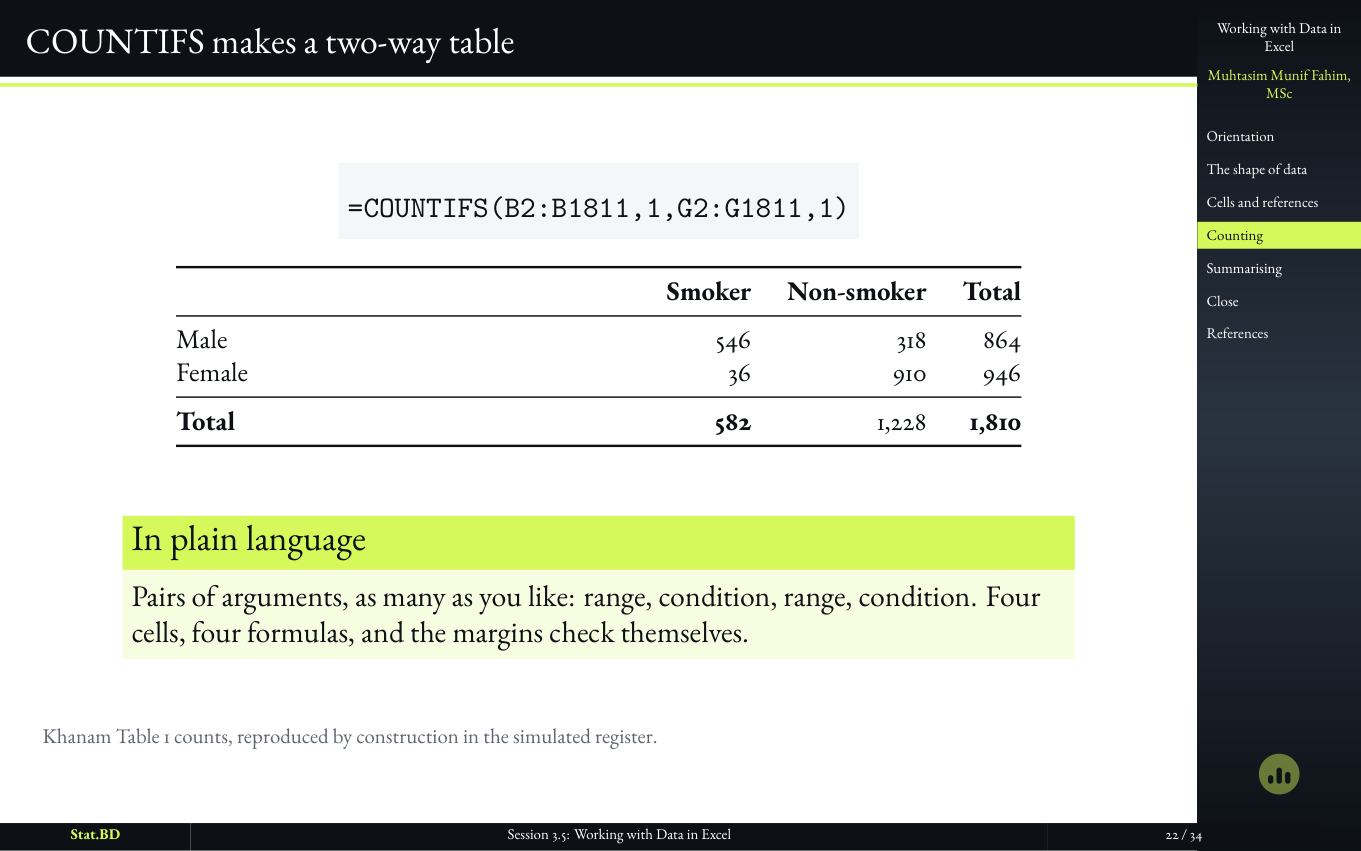
  5. Session 3.5, Act III · Counting a categorical column: COUNTIFS makes a two-way table.

    Slide 22

    COUNTIFS makes a two-way table

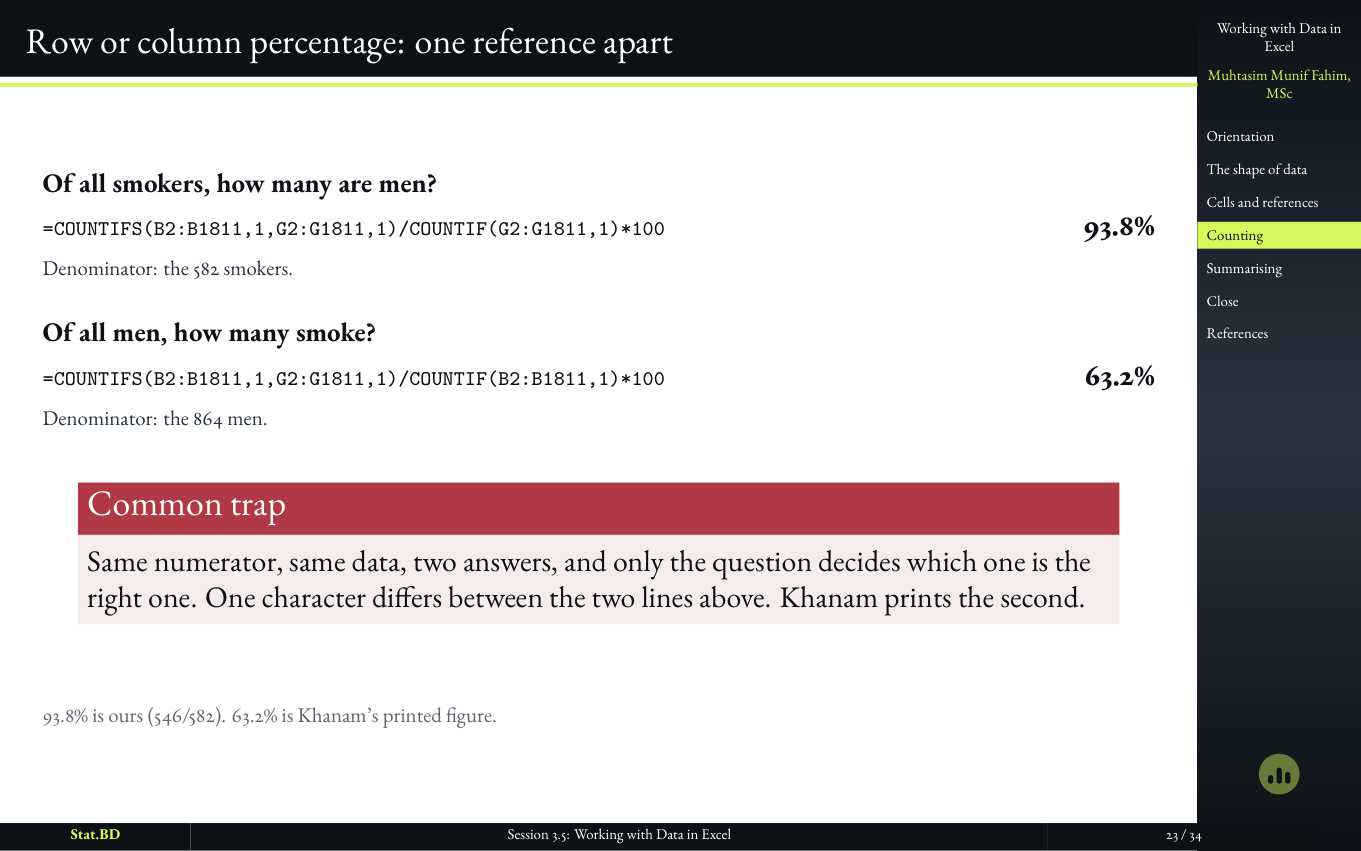
  6. Session 3.5, Act III · Counting a categorical column: Row or column percentage: one reference apart.

    Slide 23

    Row or column percentage: one reference apart

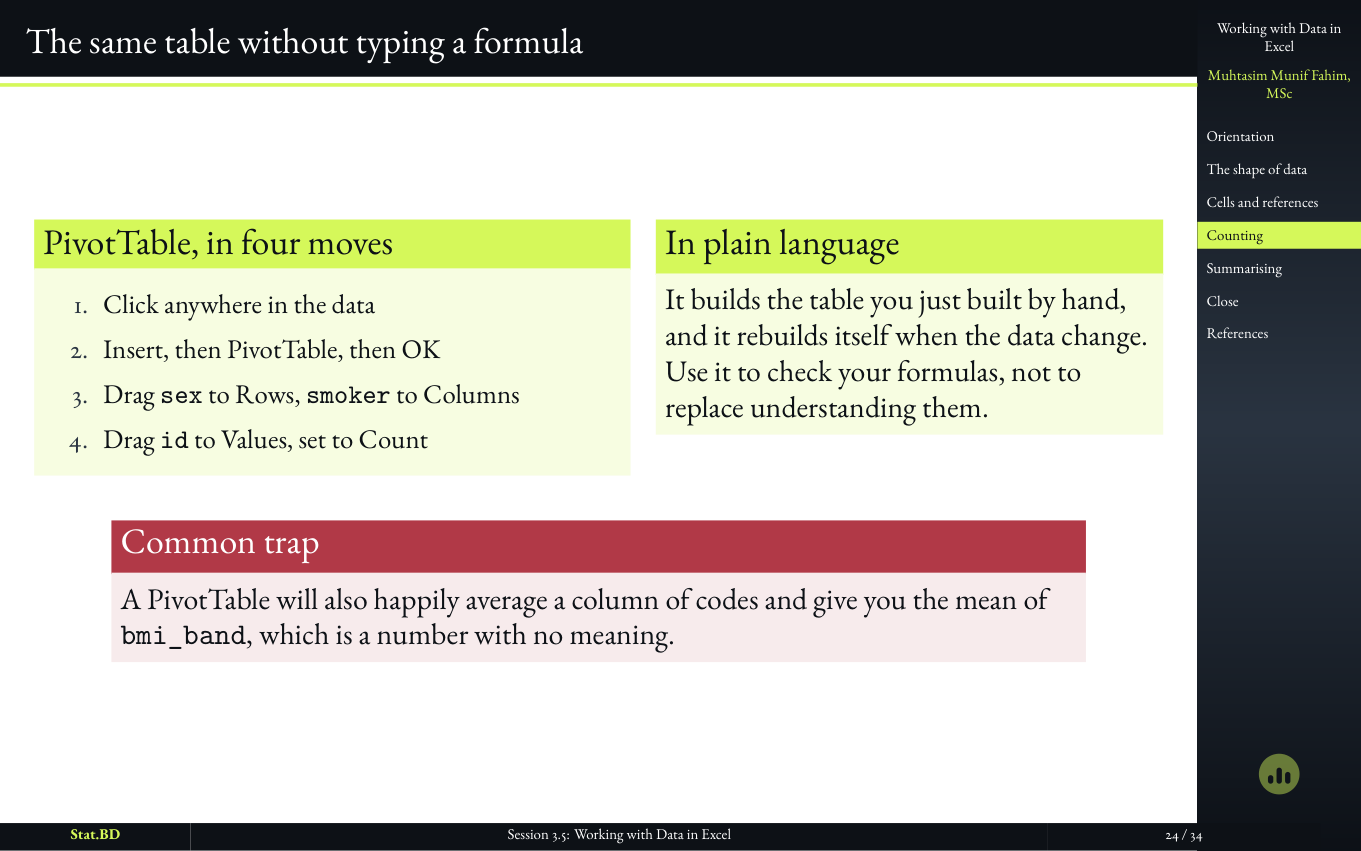
  7. Session 3.5, Act III · Counting a categorical column: The same table without typing a formula.

    Slide 24

    The same table without typing a formula

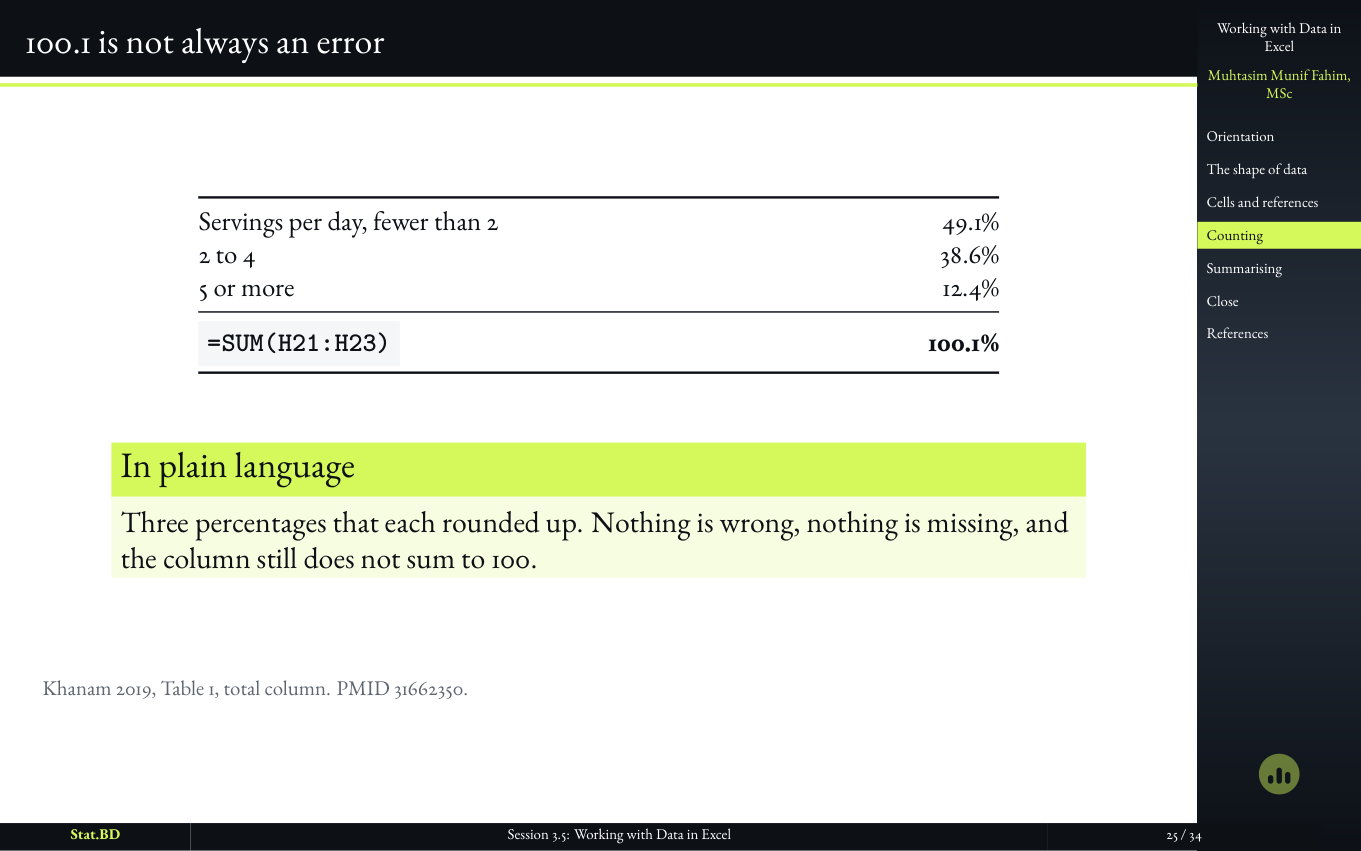
  8. Session 3.5, Act III · Counting a categorical column: 100.1 is not always an error.

    Slide 25

    100.1 is not always an error

9 slides

Act IV · Summarizing a Numerical Column

  1. Session 3.5, Act IV · Summarizing a numerical column: Act IV · Summarizing a numerical column.

    Slide 26

    Act IV · Summarizing a Numerical Column
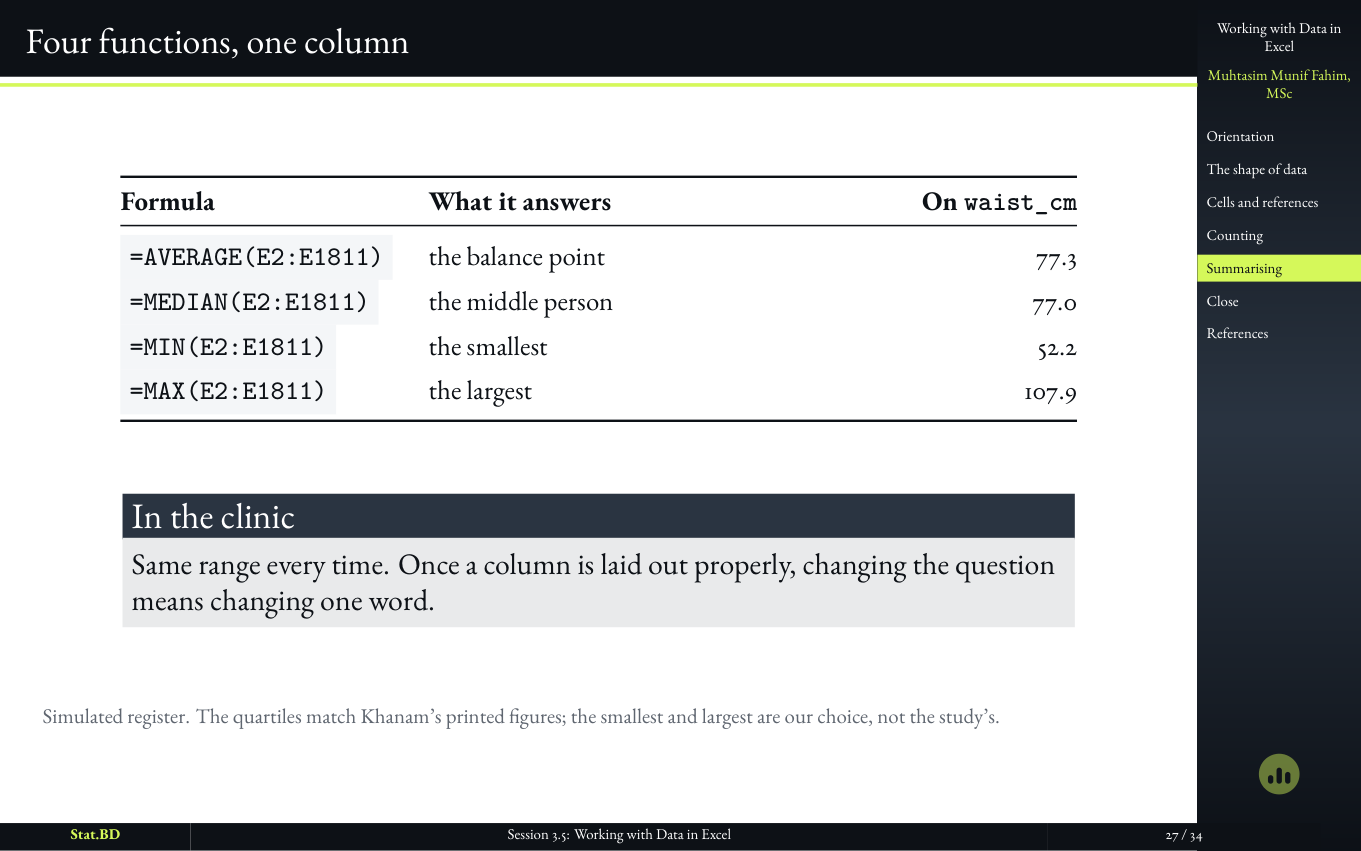
  2. Session 3.5, Act IV · Summarizing a numerical column: Four functions, one column.

    Slide 27

    Four functions, one column

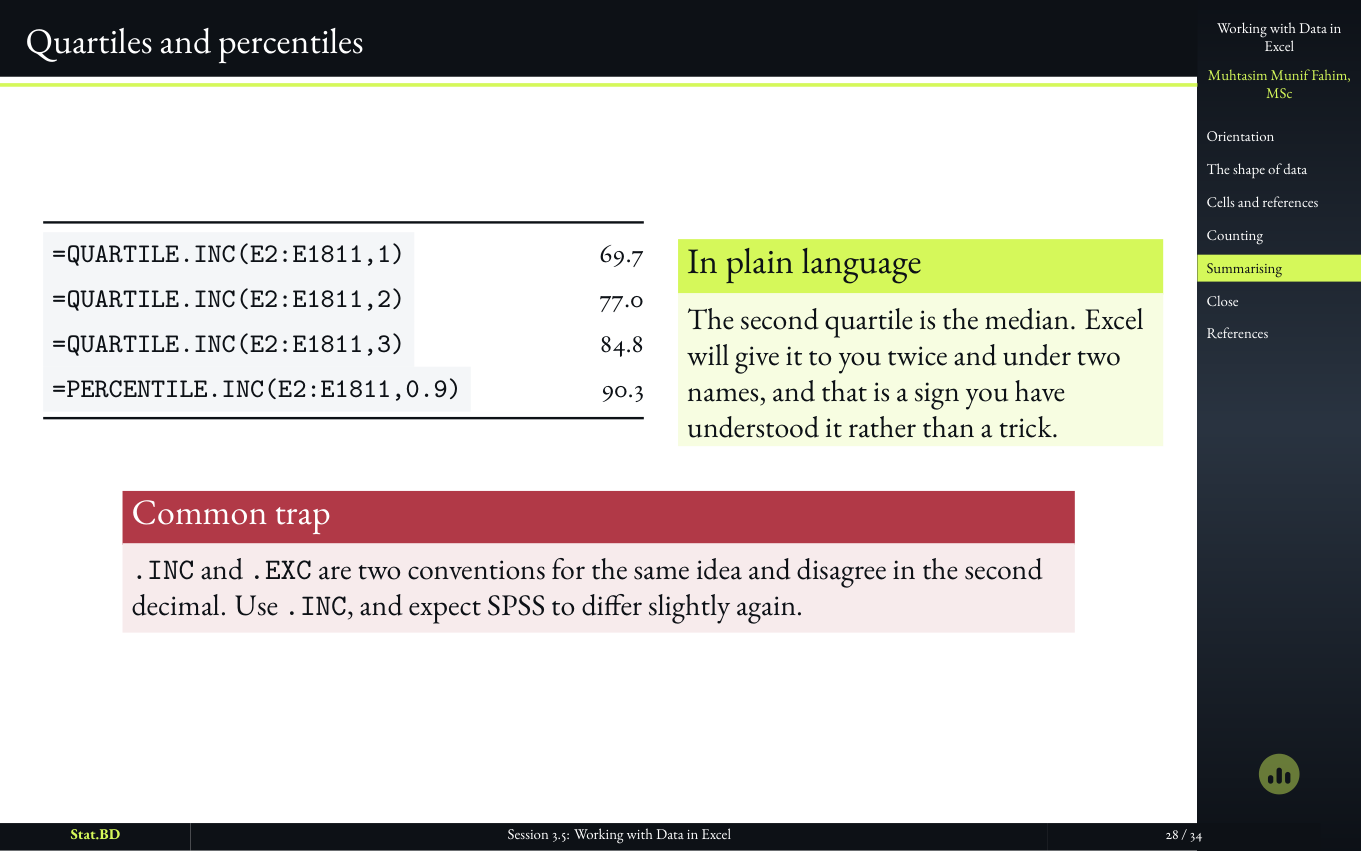
  3. Session 3.5, Act IV · Summarizing a numerical column: Quartiles and percentiles.

    Slide 28

    Quartiles and percentiles

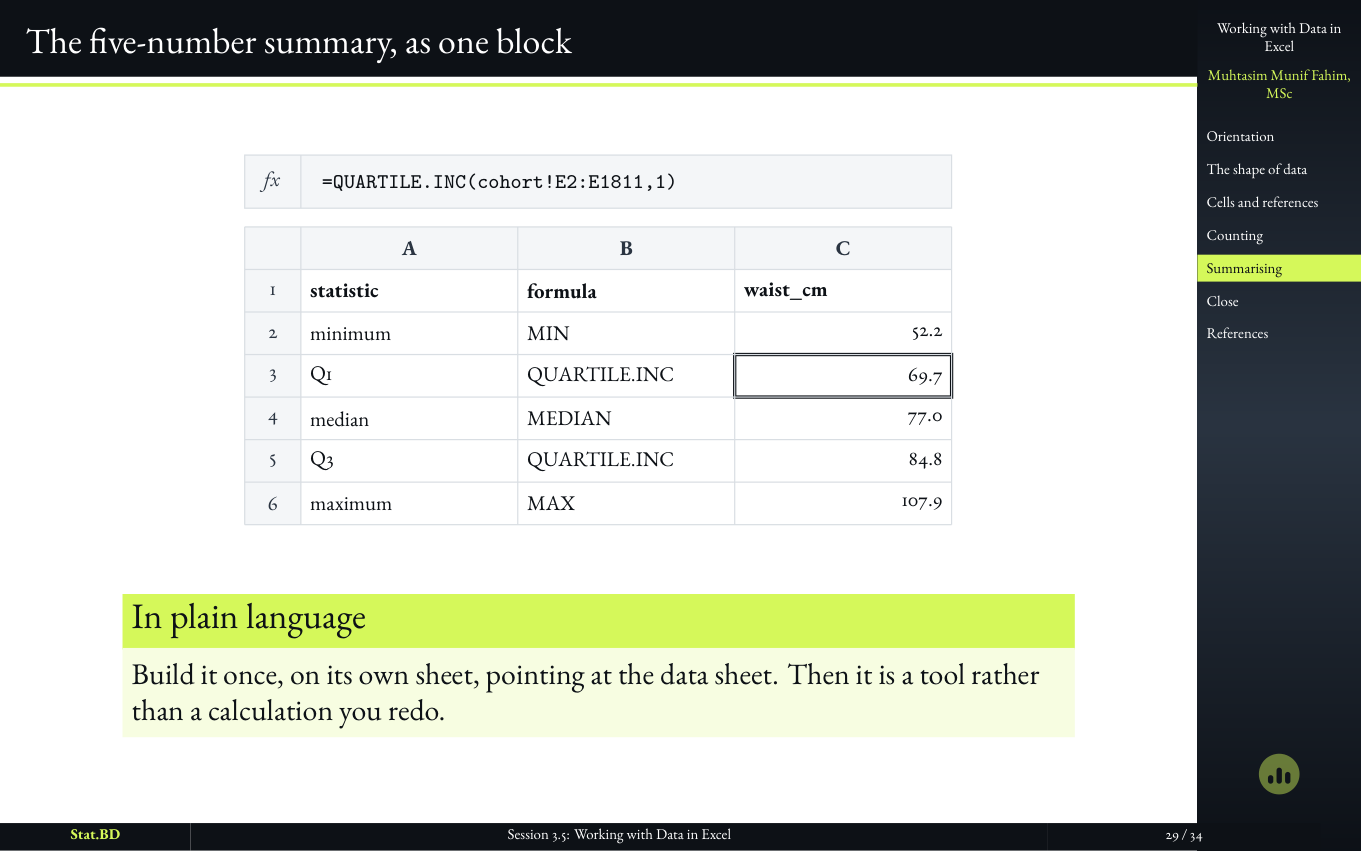
  4. Session 3.5, Act IV · Summarizing a numerical column: The five-number summary, as one block.

    Slide 29

    The five-number summary, as one block

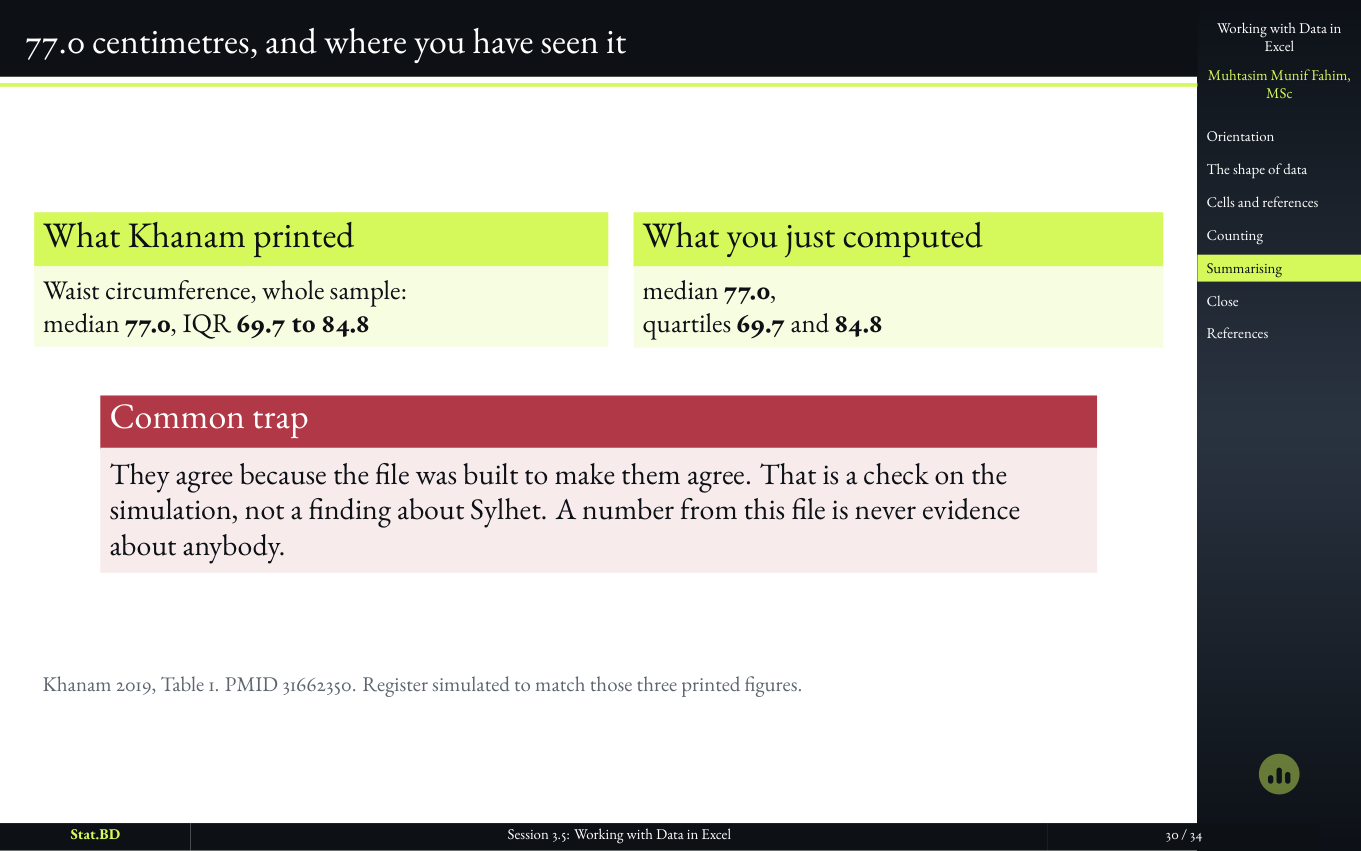
  5. Session 3.5, Act IV · Summarizing a numerical column: 77.0 centimetres, and where you have seen it.

    Slide 30

    77.0 centimetres, and where you have seen it

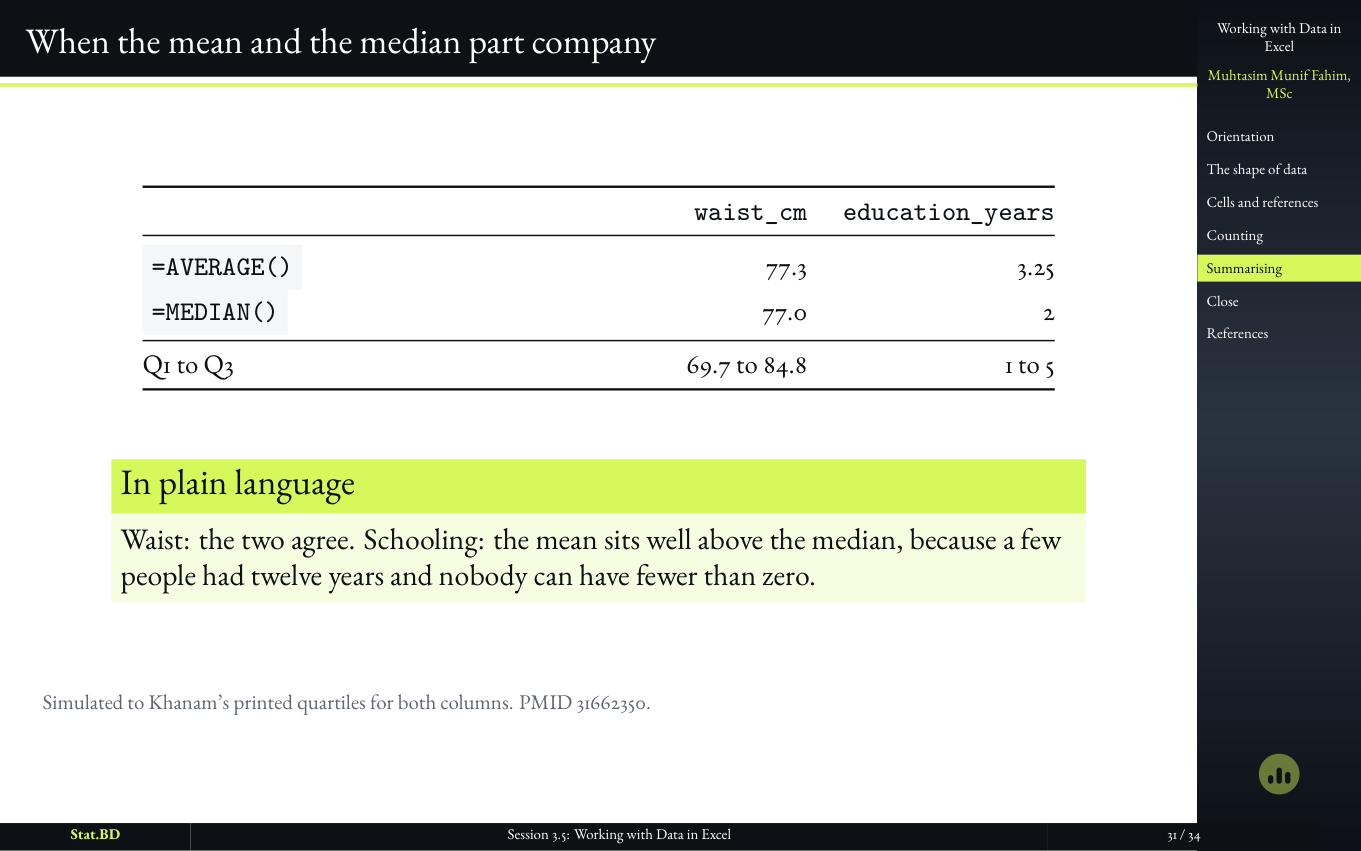
  6. Session 3.5, Act IV · Summarizing a numerical column: When the mean and the median part company.

    Slide 31

    When the mean and the median part company

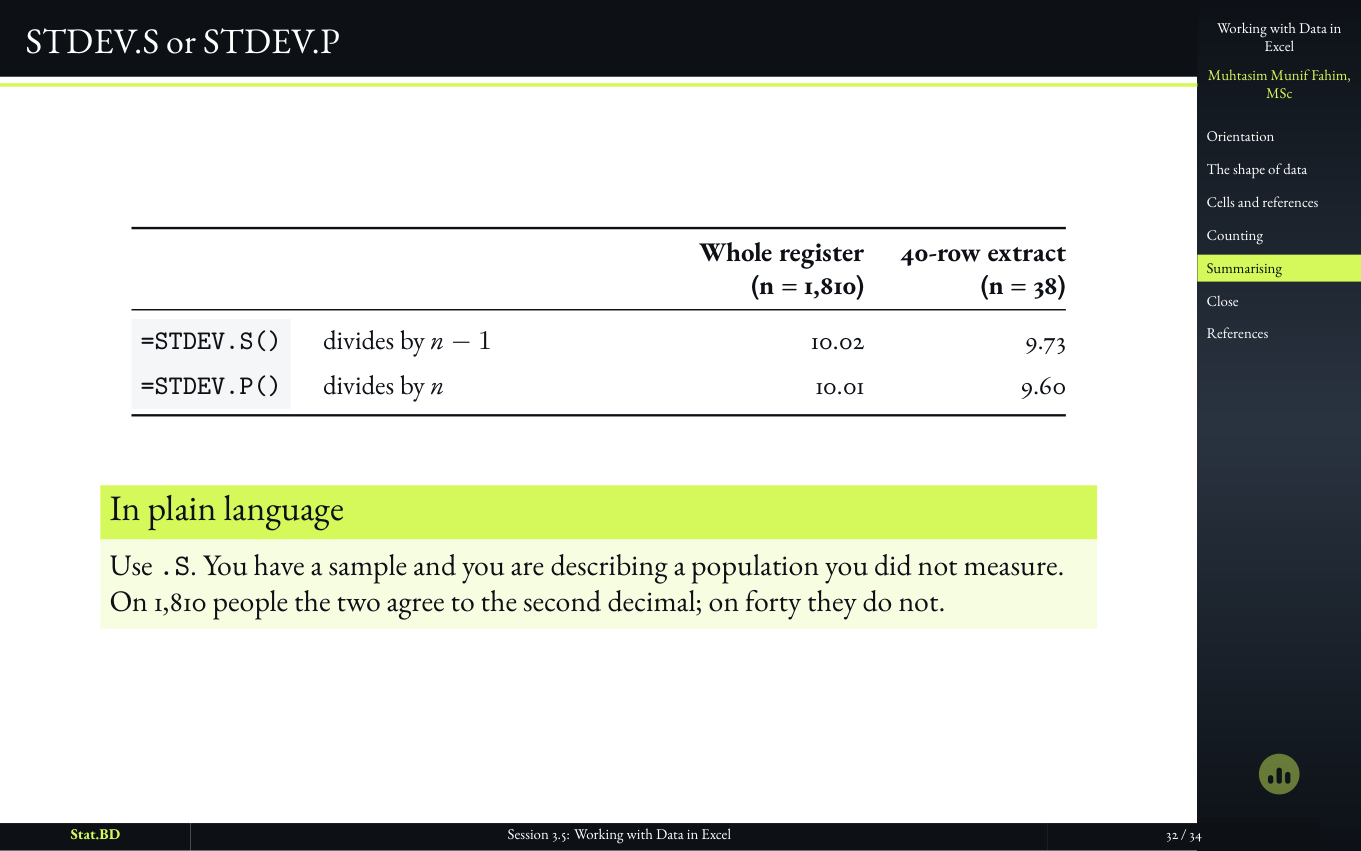
  7. Session 3.5, Act IV · Summarizing a numerical column: STDEV.S or STDEV.P.

    Slide 32

    STDEV.S or STDEV.P

  8. Slide collecting the Excel functions the session needs on one card.

    Slide 33

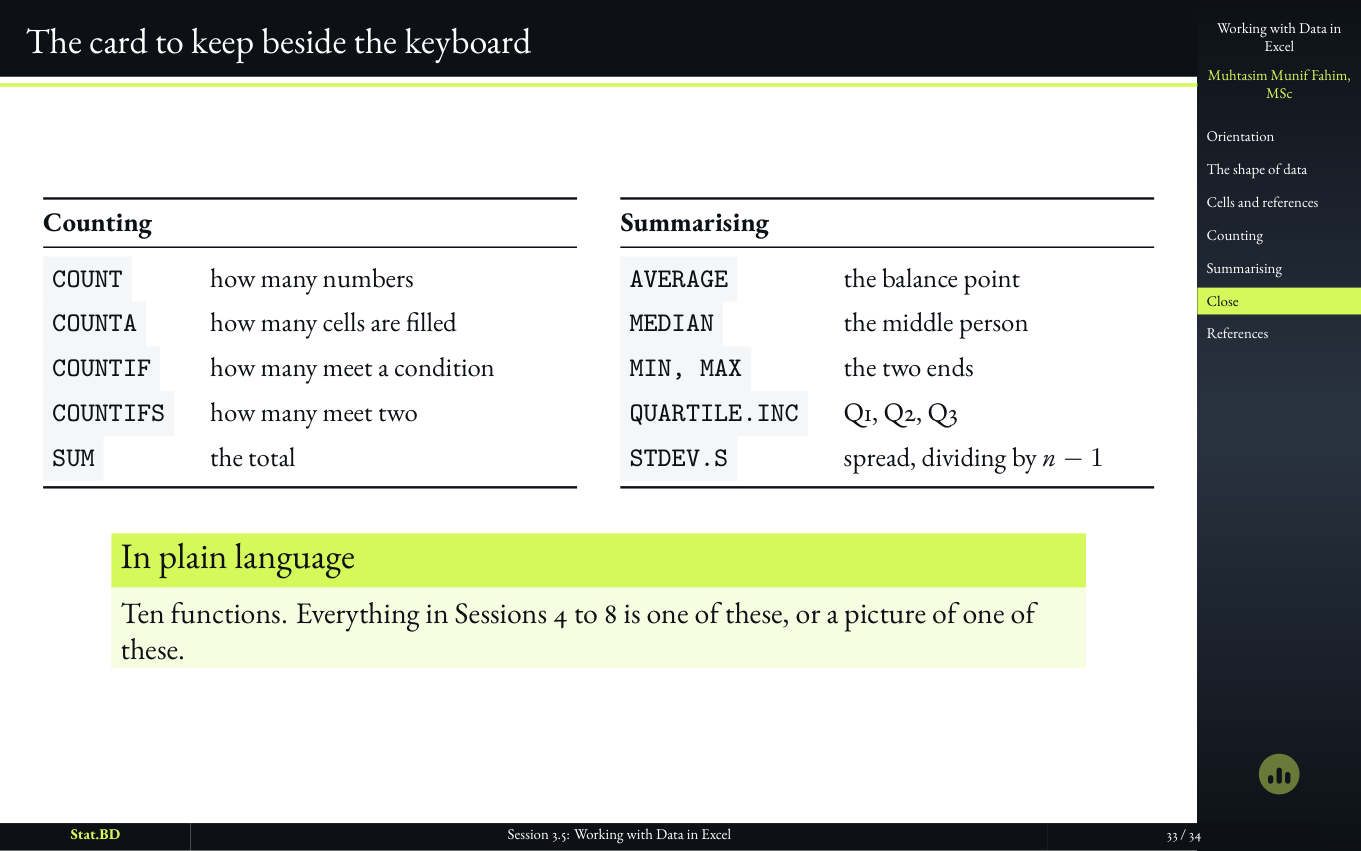
    The card to keep beside the keyboard

    A short list, not a software syllabus. COUNT, COUNTIF, the five-number summary, and the one rule about missing values. Session 4 then asks which of those numbers a paper should print.

  9. Session 3.5, Act IV · Summarizing a numerical column: What the next session does with all of this.

    Slide 34

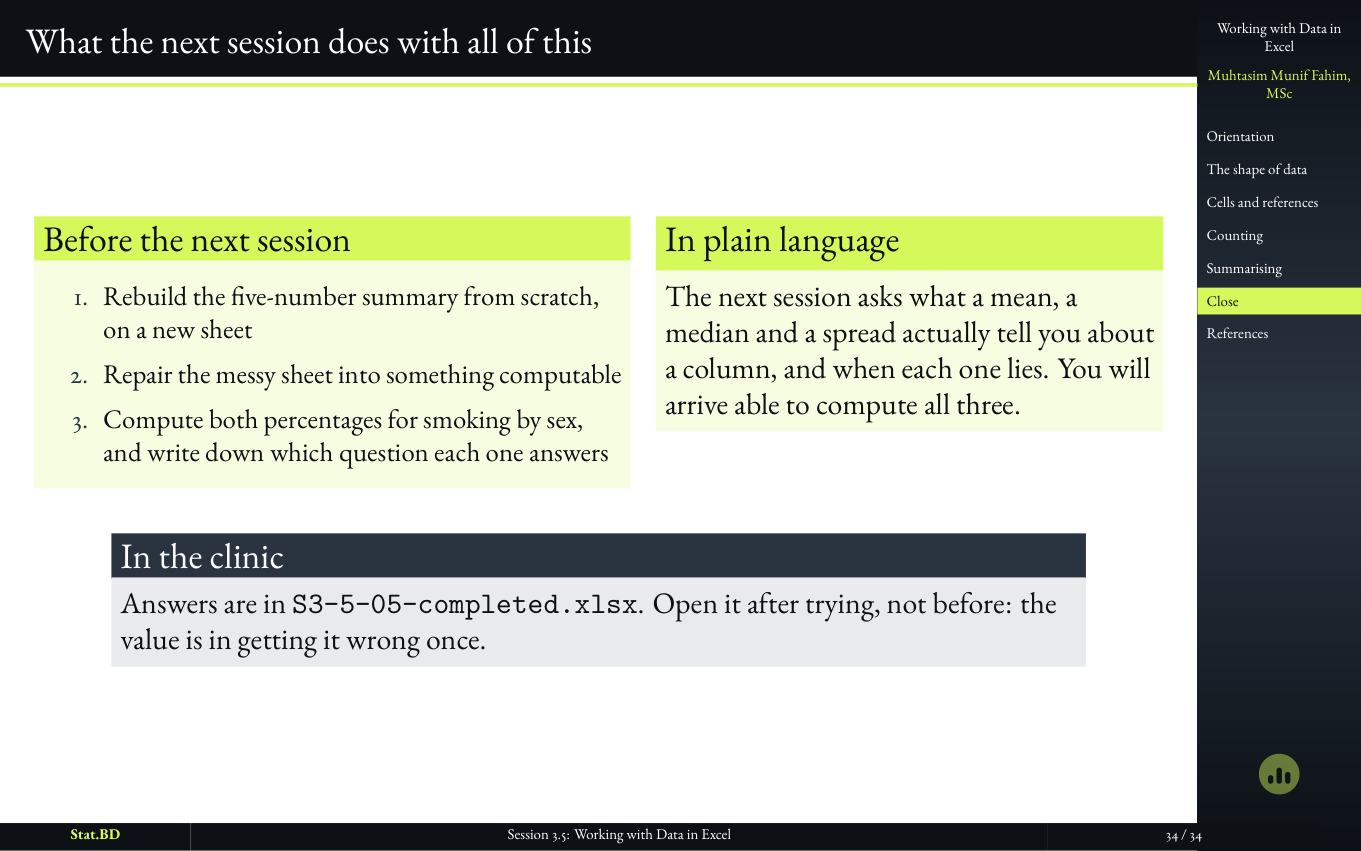
    What the next session does with all of this

Named and stopped

What We Deliberately Did Not Teach Yet.

  • Which summary a paper should print (Session 4).
  • Distributions and outliers (Session 5).
  • SPSS labs follow the concept. They do not replace this sheet.

Next session

Session 4: Describing Numerical Data

The next class is already up. Or request a plan built around your own question.