Session 4 of 30

Describing Numerical Data

Where the middle is, how spread out it is, and which pair of numbers to print

120 minutes · 37 slides in 6 Acts

3 slides

Orientation

  1. Session 4 title slide: Describing Numerical Data.

    Slide 1

    Describing Numerical Data

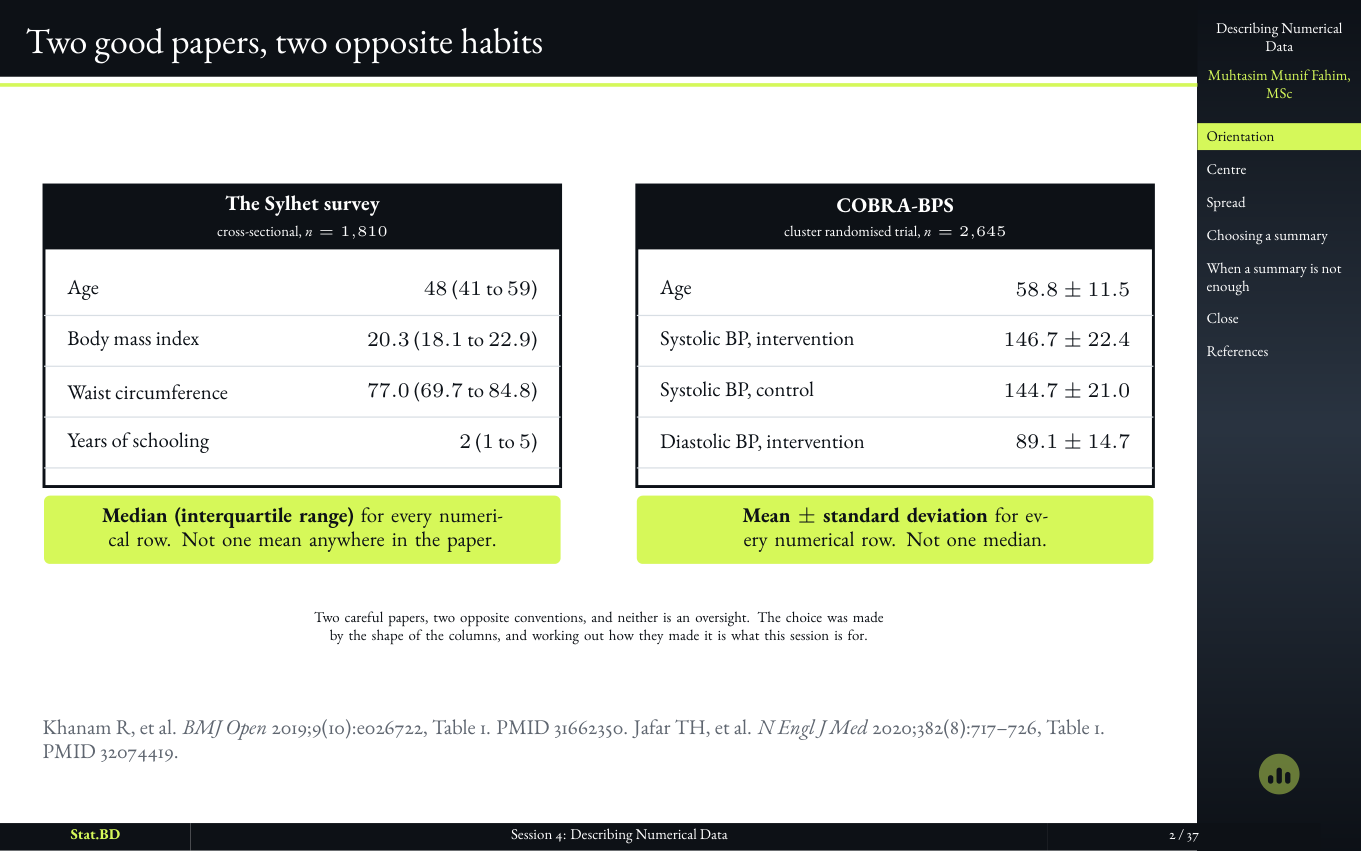
  2. Slide comparing a Sylhet survey table that prints medians with a COBRA-BPS table that prints means.

    Slide 2

    Two Good Papers, Two Opposite Habits

    The session opens on a puzzle, not a definition. Same kind of thing, numbers measured on people, and opposite conventions. Somebody decided. On what?

  3. Session 4, Orientation: What you will be able to do at the end of today.

    Slide 3

    What you will be able to do at the end of today

8 slides

Act I · Where the Middle Is

  1. Session 4, Act I · Where the middle is: Act I · Where the middle is.

    Slide 4

    Act I · Where the Middle Is

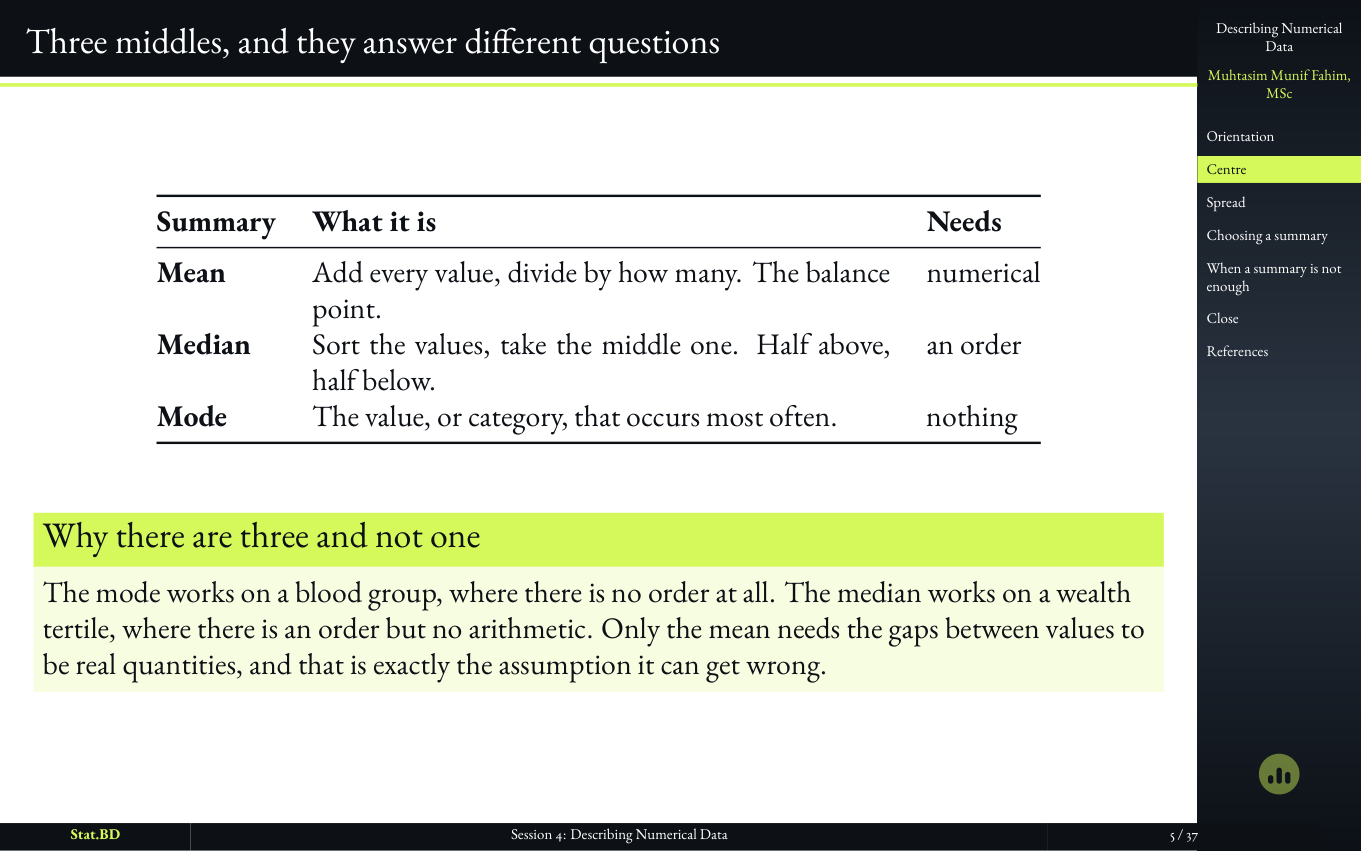
  2. Slide distinguishing mean, median, and mode as three different middles.

    Slide 5

    Three middles, and they answer different questions

    Mean, median, and mode are not three ways to say ‘average.’ They answer three different questions about the same column. The rest of the afternoon is about which question a paper is allowed to ask.

  3. Session 4, Act I · Where the middle is: One value moves, and only one of them moves with it.

    Slide 6

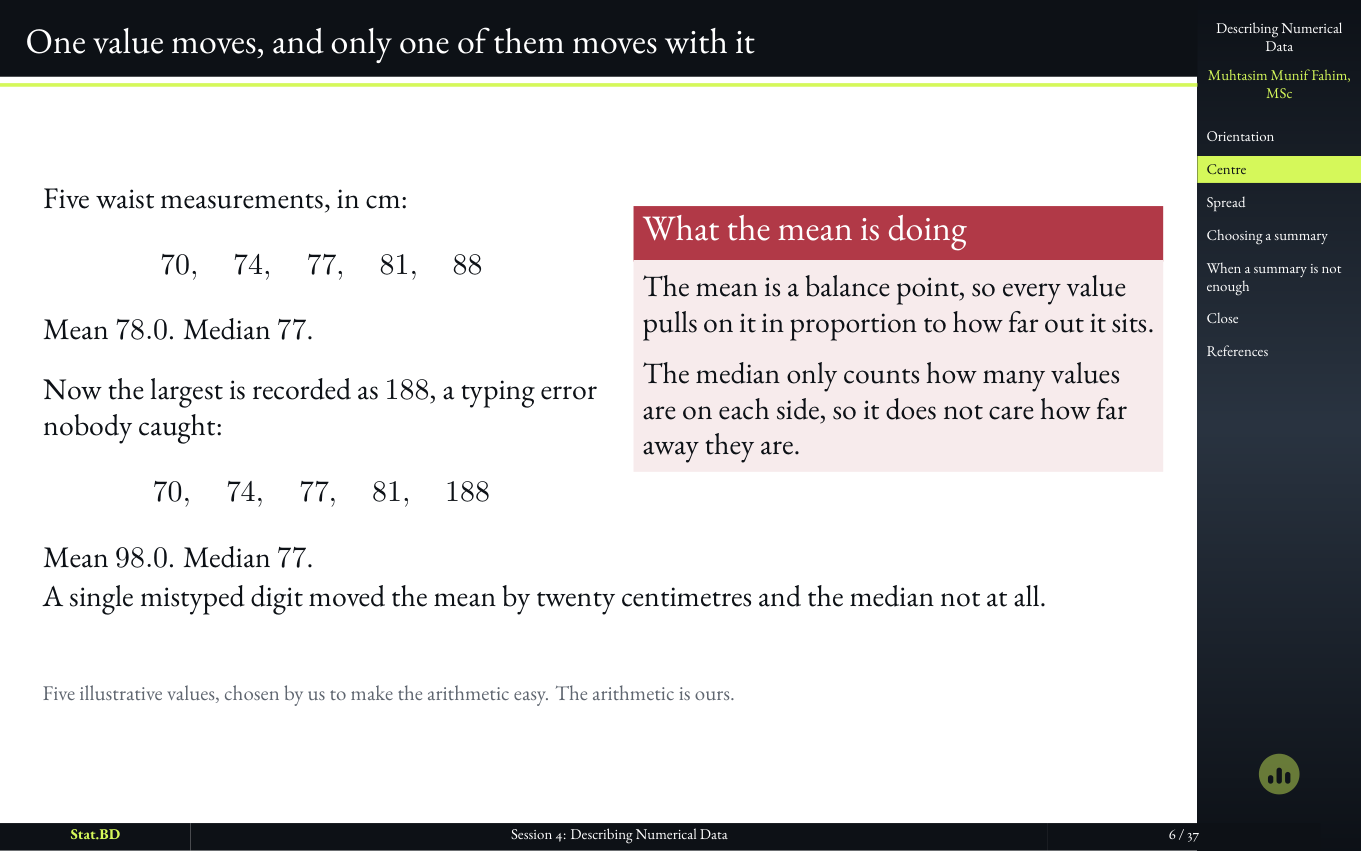
    One value moves, and only one of them moves with it

  4. Session 4, Act I · Where the middle is: Trimming the ends, and the summary that survives it.

    Slide 7

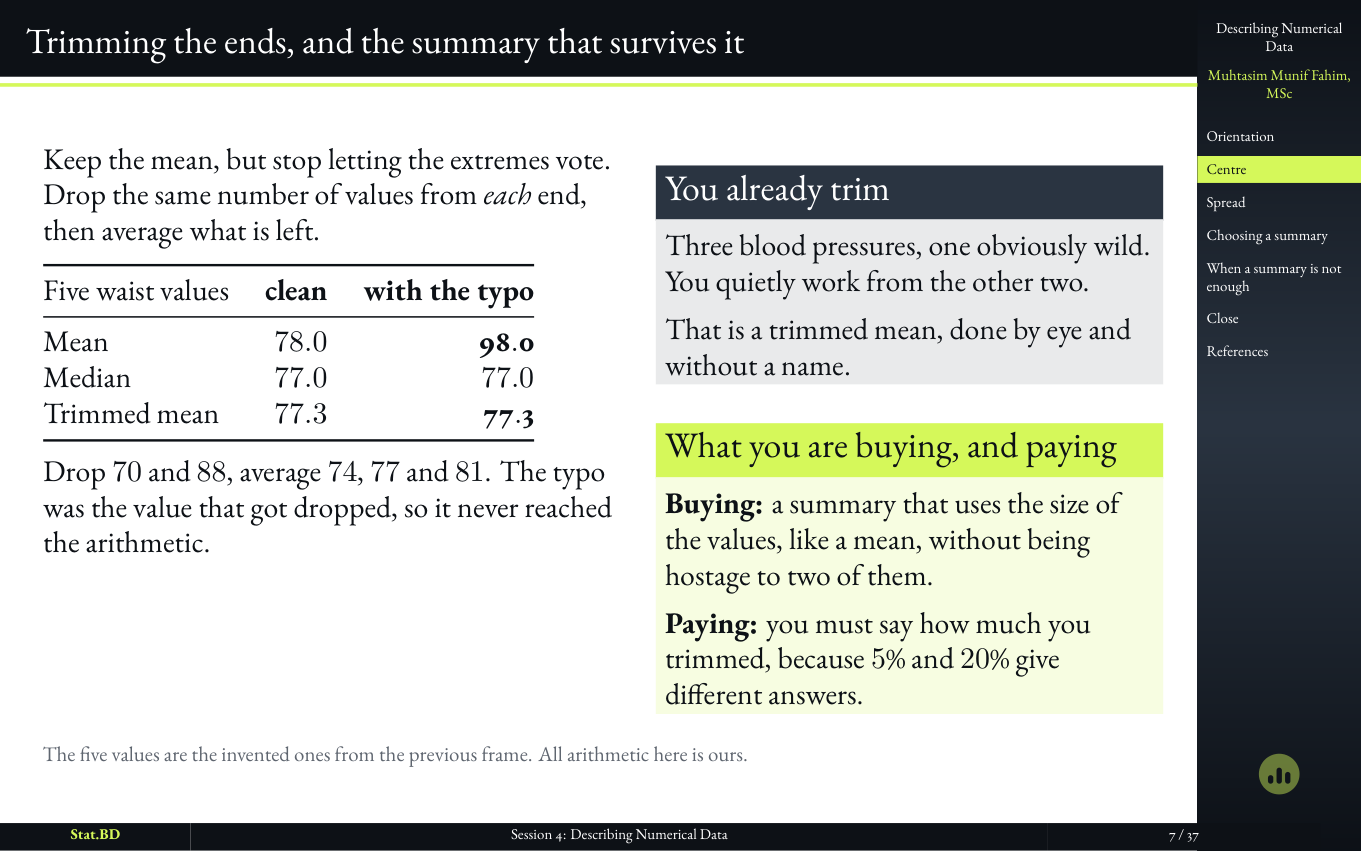
    Trimming the ends, and the summary that survives it

  5. Session 4, Act I · Where the middle is: The spread that matches the median.

    Slide 8

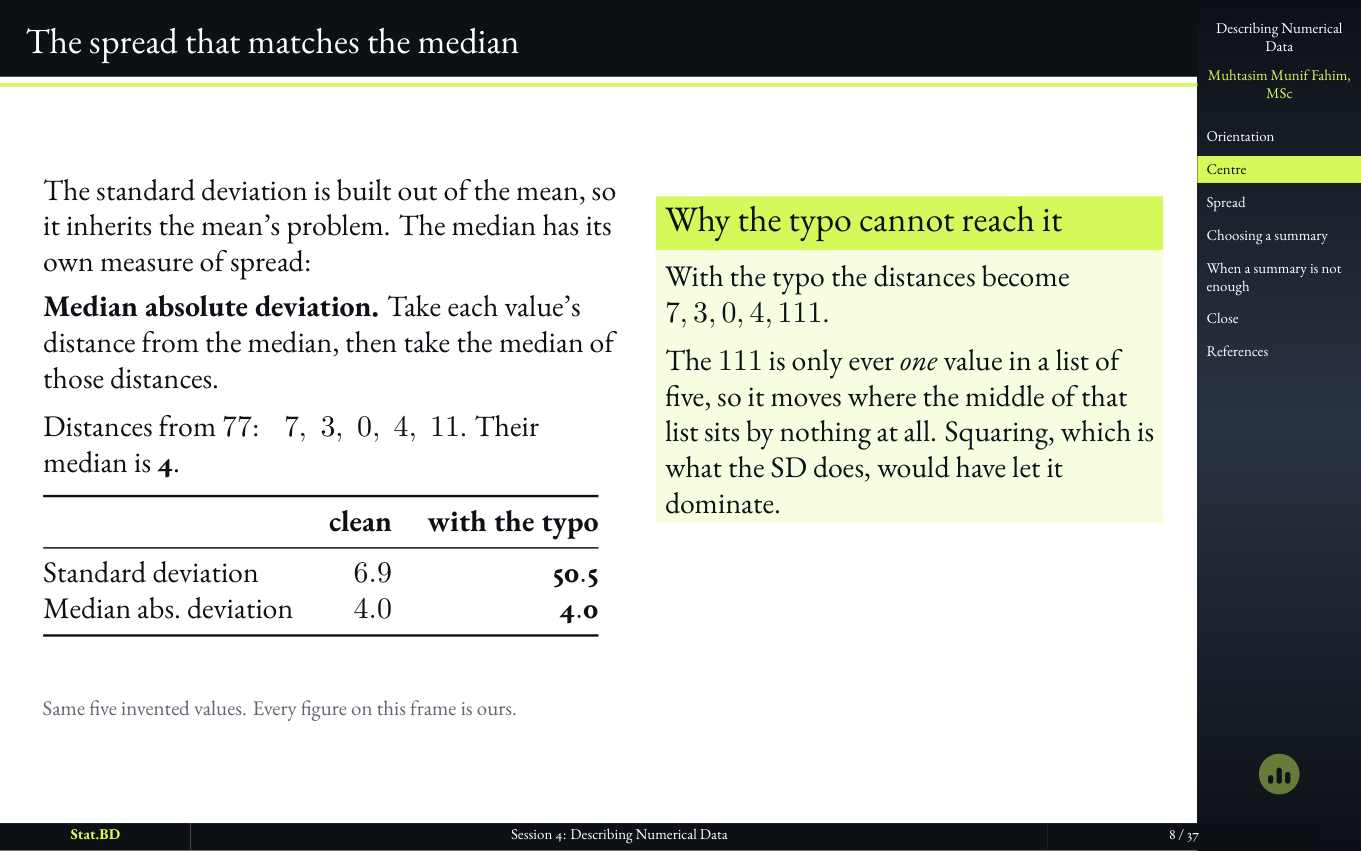
    The spread that matches the median

  6. Session 4, Act I · Where the middle is: So the gap between them describes the shape.

    Slide 9

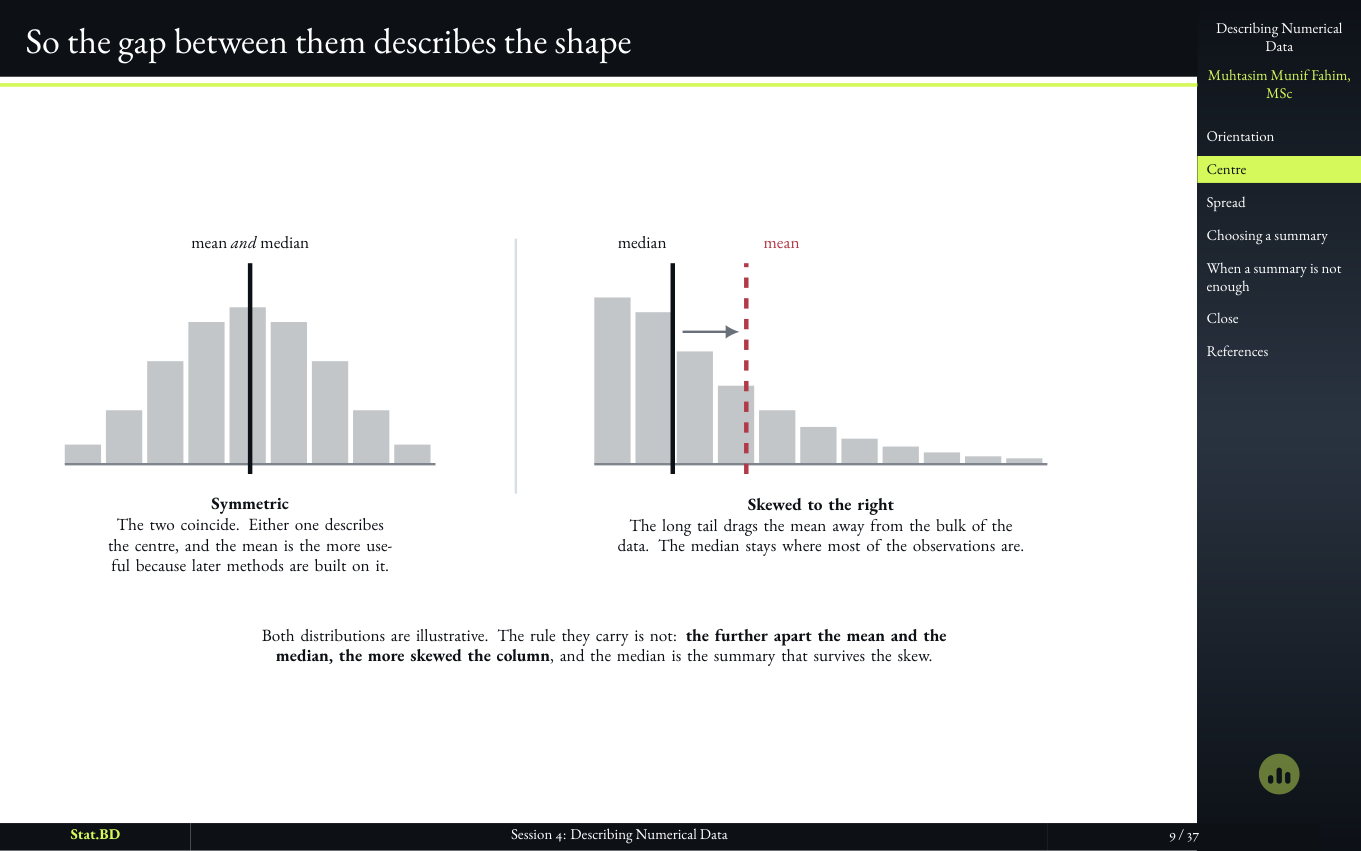
    So the gap between them describes the shape

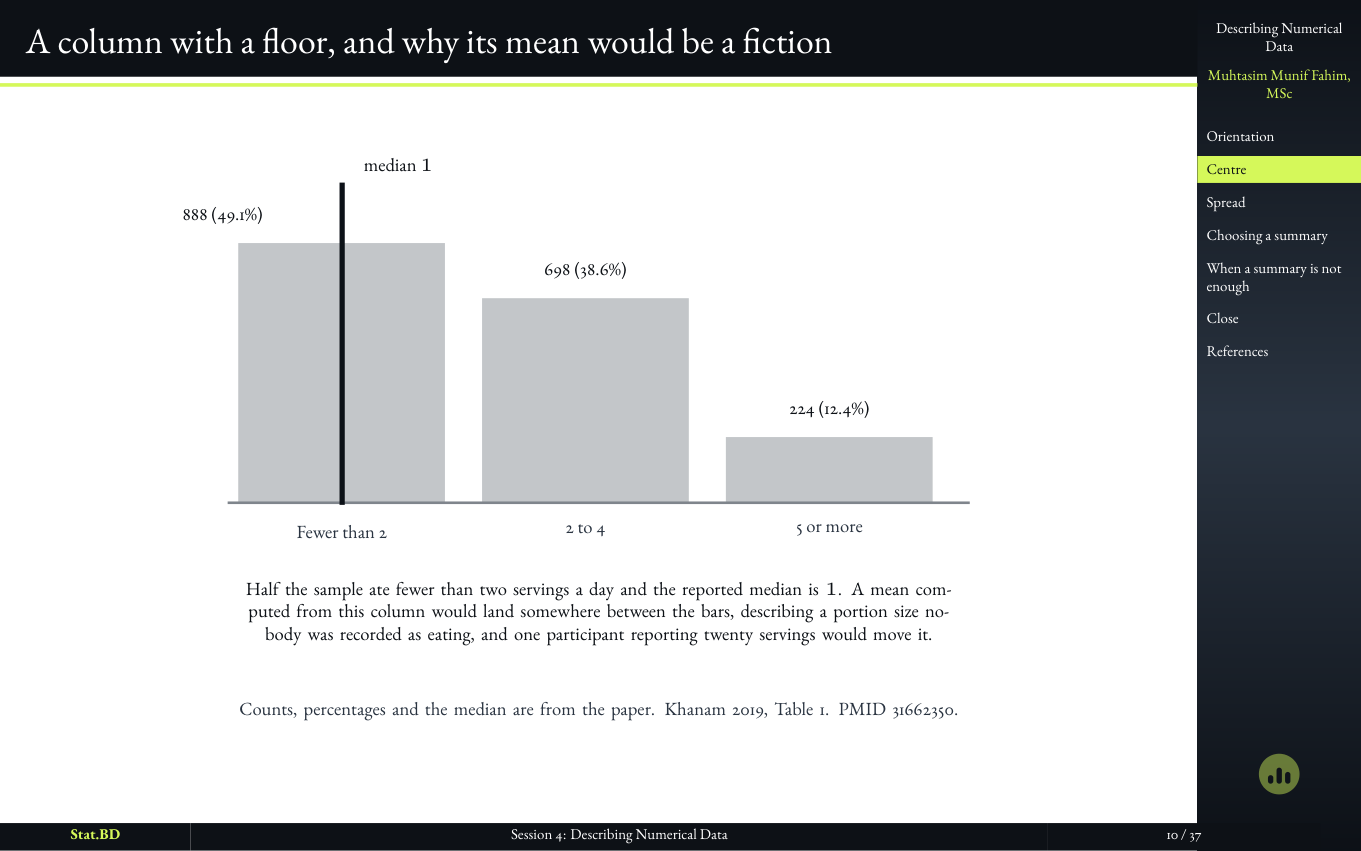
  7. Slide showing why the mean of a column with a floor at zero can be a fiction.

    Slide 10

    A column with a floor, and why its mean would be a fiction

    Years of schooling, counts, anything that cannot go below zero: the mean can sit in a place no person occupies. That is already enough to prefer a median, before anyone has drawn a histogram.

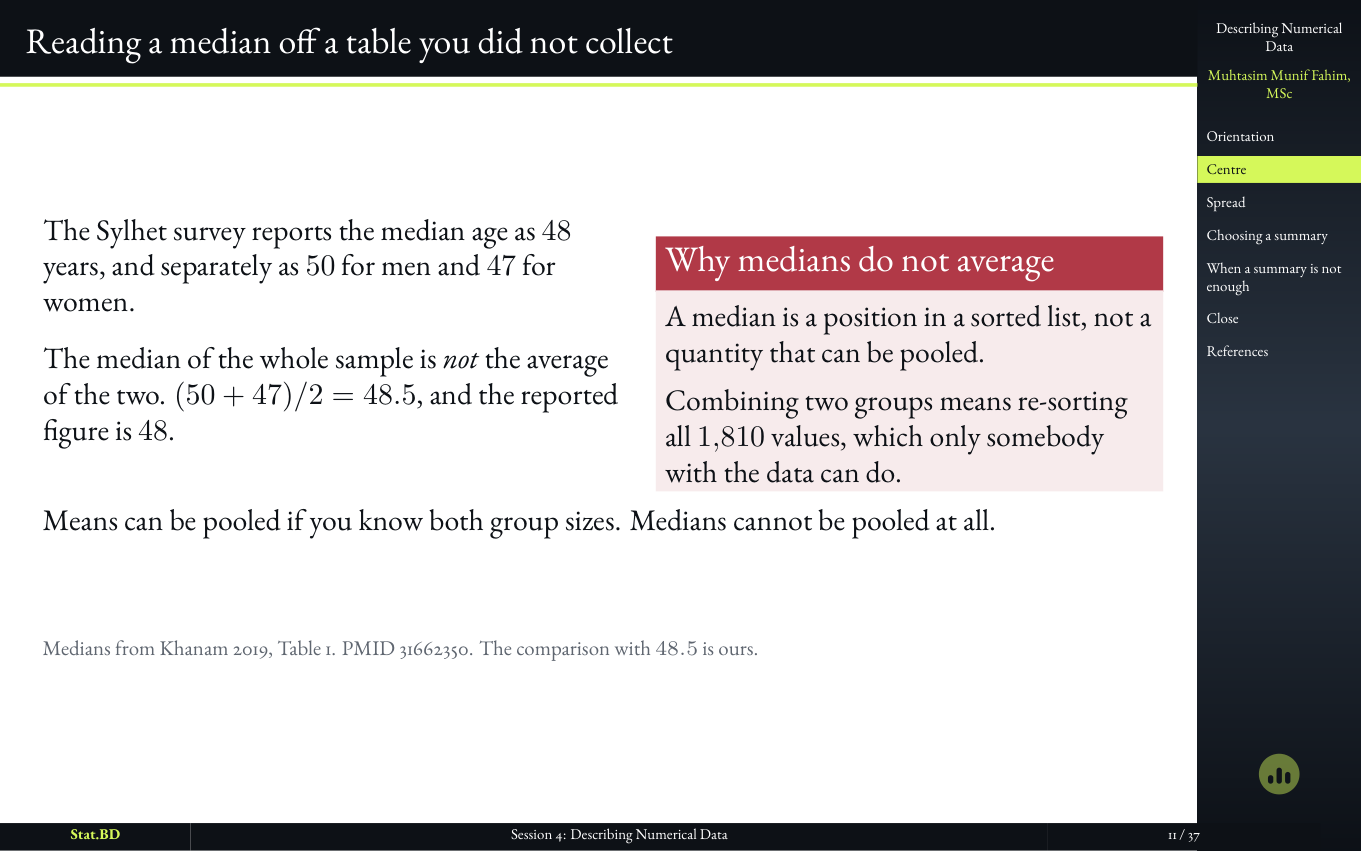
  8. Session 4, Act I · Where the middle is: Reading a median off a table you did not collect.

    Slide 11

    Reading a median off a table you did not collect

11 slides

Act II · How Spread Out It Is

  1. Session 4, Act II · How spread out it is: Act II · How spread out it is.

    Slide 12

    Act II · How Spread Out It Is
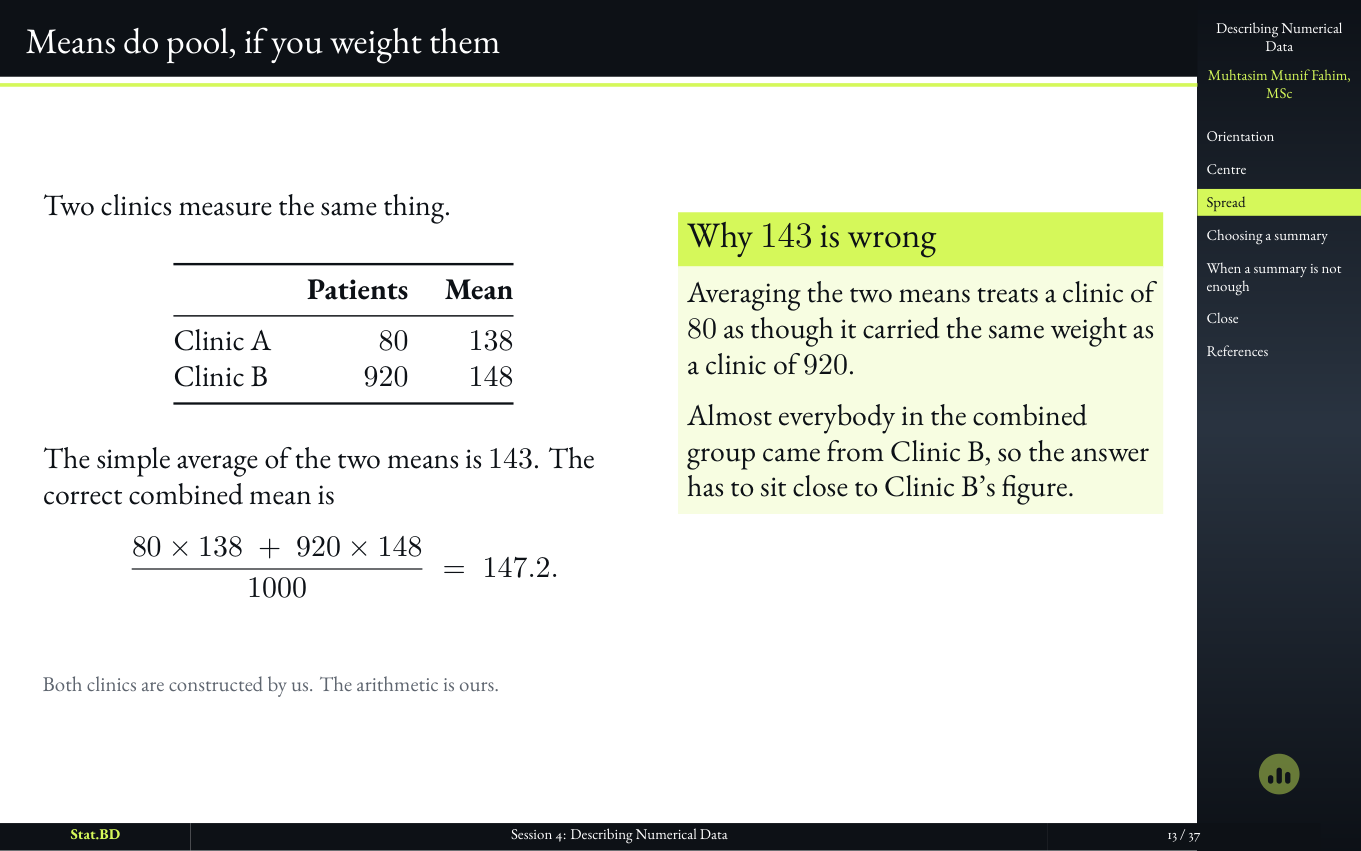
  2. Session 4, Act II · How spread out it is: Means do pool, if you weight them.

    Slide 13

    Means do pool, if you weight them

  3. Session 4, Act II · How spread out it is: A center on its own describes almost nothing.

    Slide 14

    A center on its own describes almost nothing

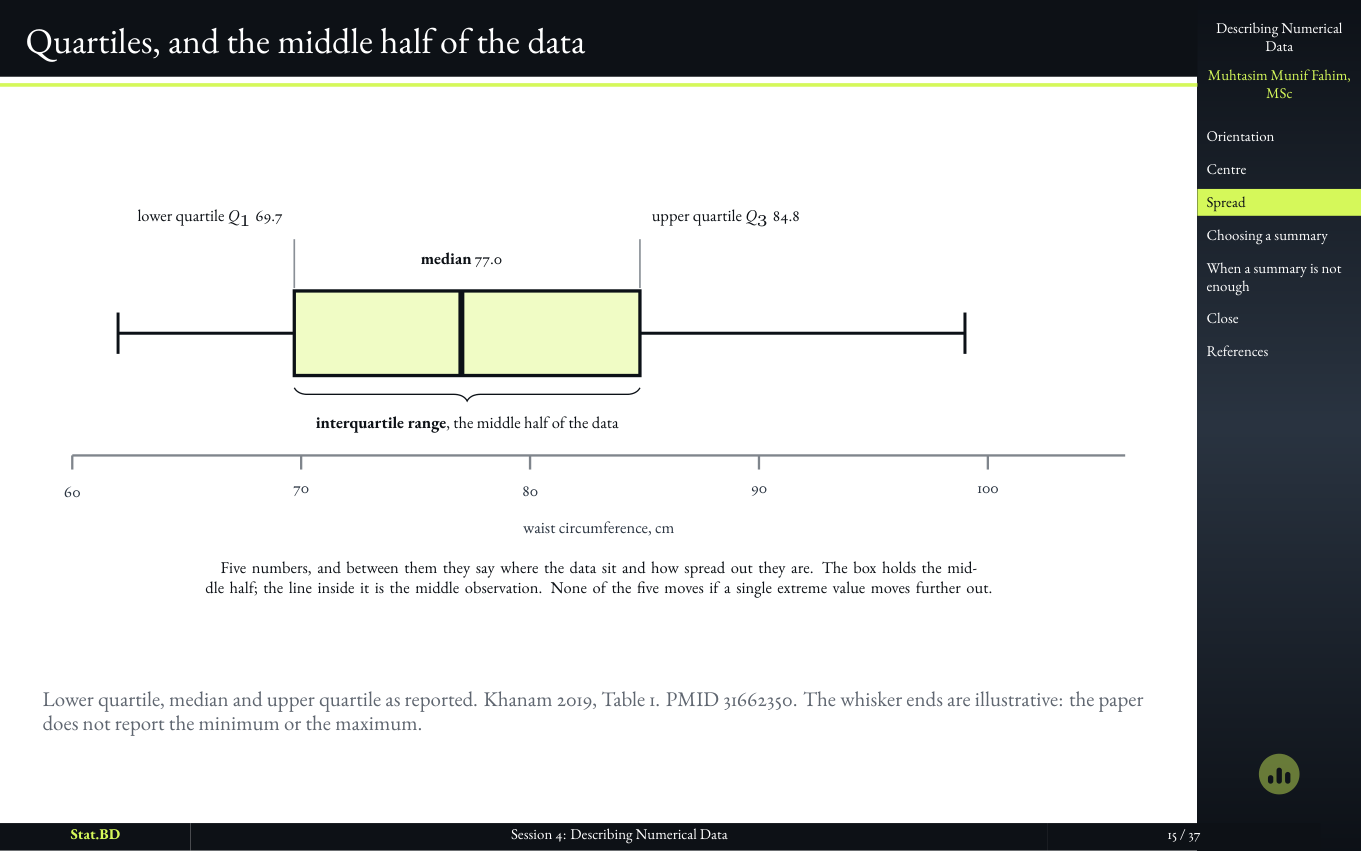
  4. Session 4, Act II · How spread out it is: Quartiles, and the middle half of the data.

    Slide 15

    Quartiles, and the middle half of the data

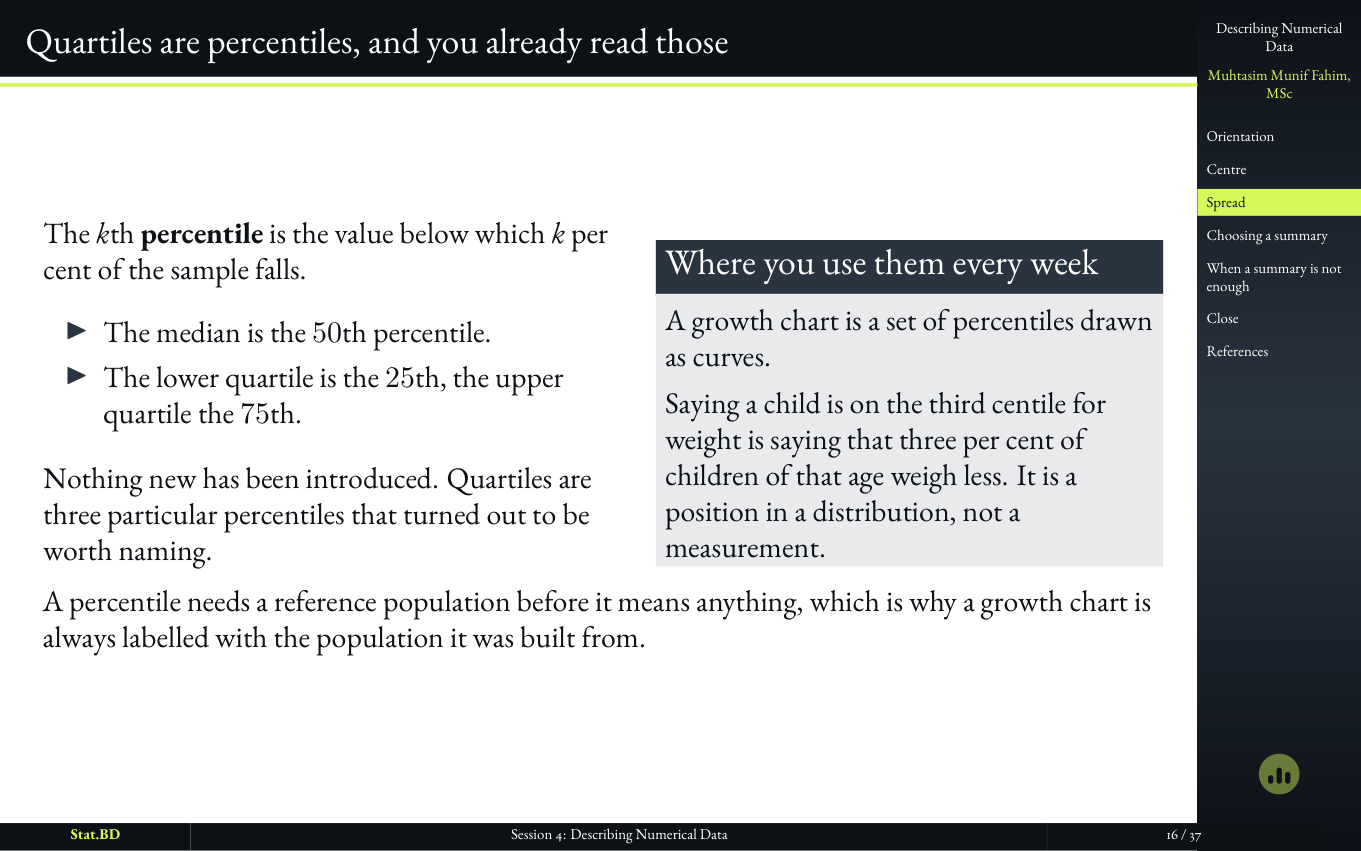
  5. Session 4, Act II · How spread out it is: Quartiles are percentiles, and you already read those.

    Slide 16

    Quartiles are percentiles, and you already read those

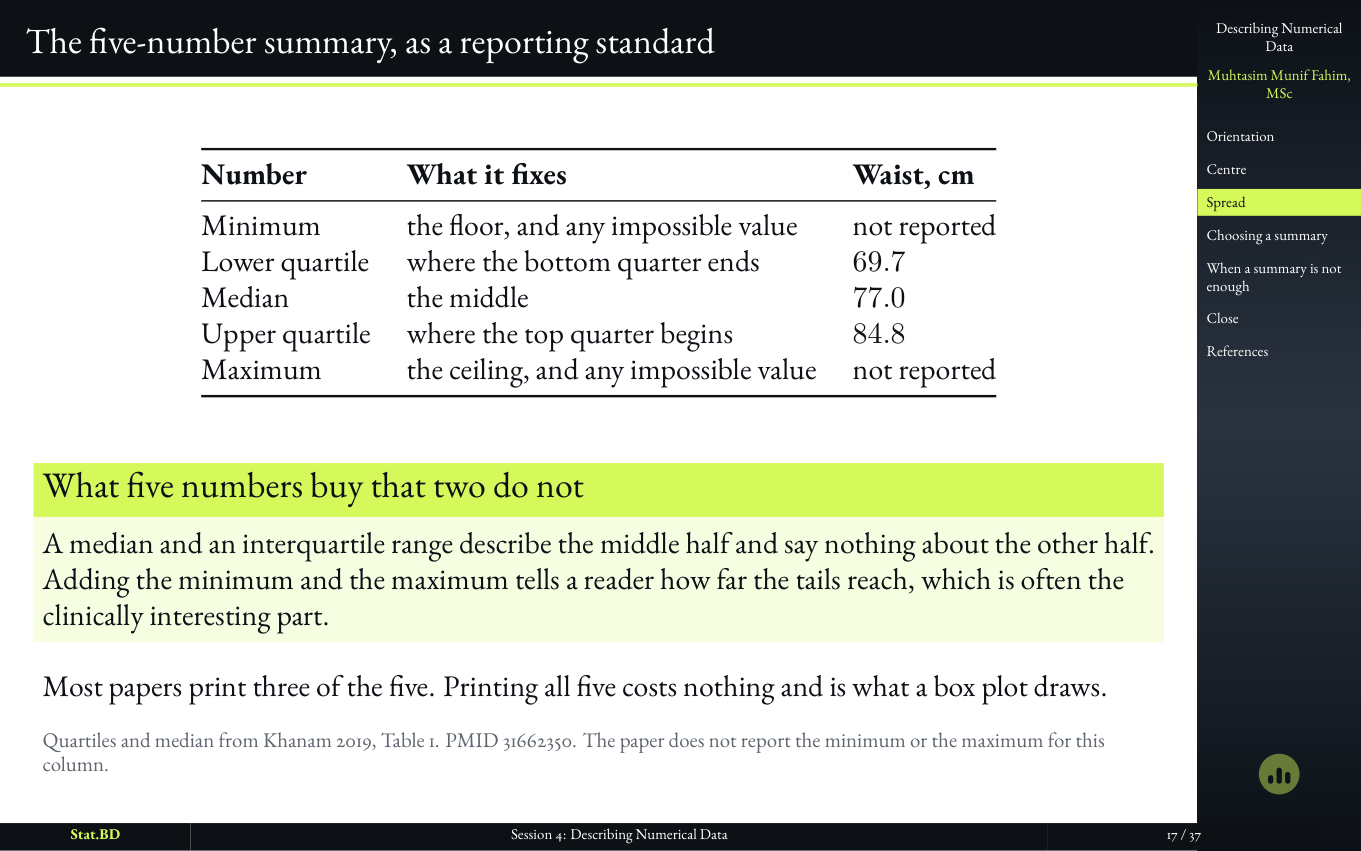
  6. Session 4, Act II · How spread out it is: The five-number summary, as a reporting standard.

    Slide 17

    The five-number summary, as a reporting standard

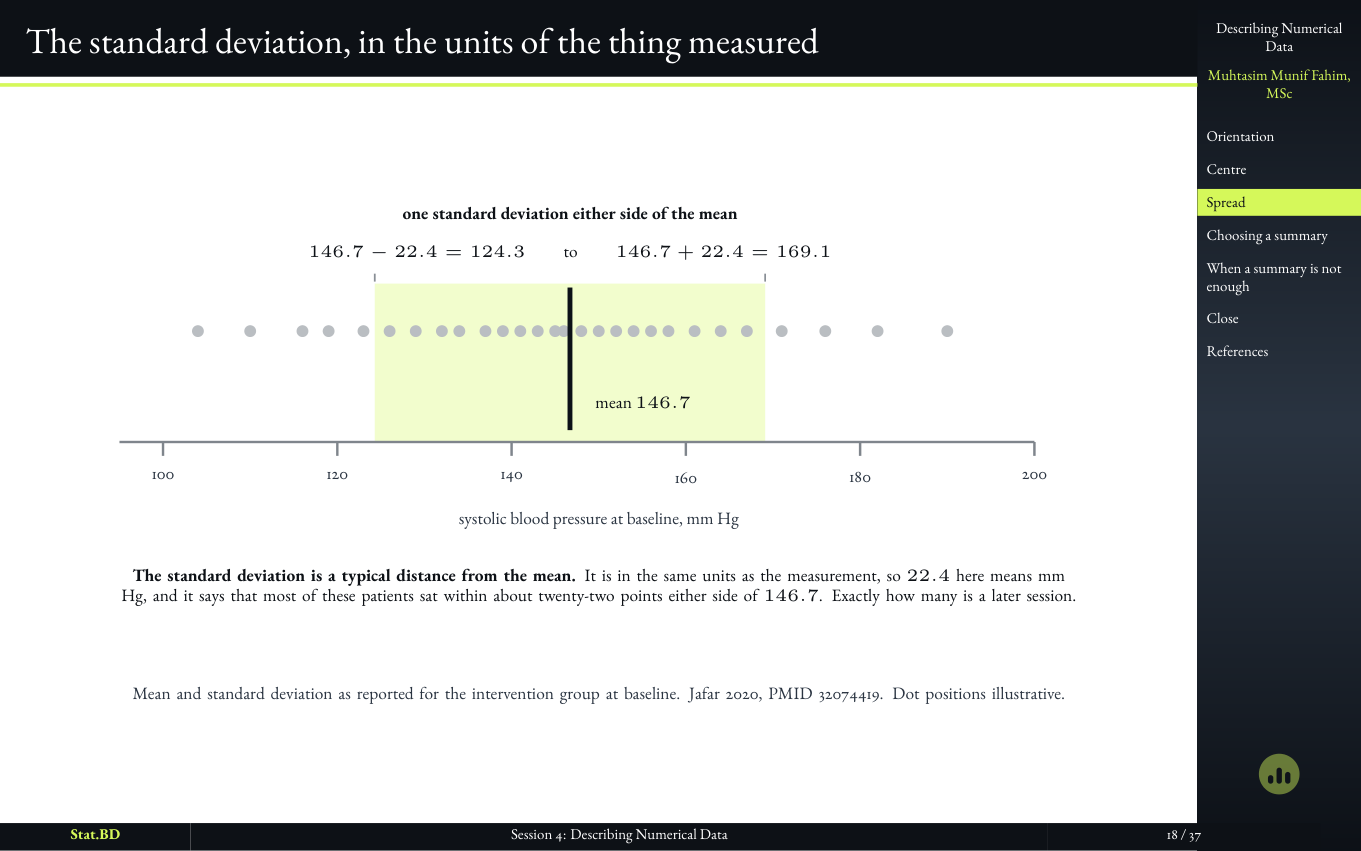
  7. Session 4, Act II · How spread out it is: The standard deviation, in the units of the thing measured.

    Slide 18

    The standard deviation, in the units of the thing measured

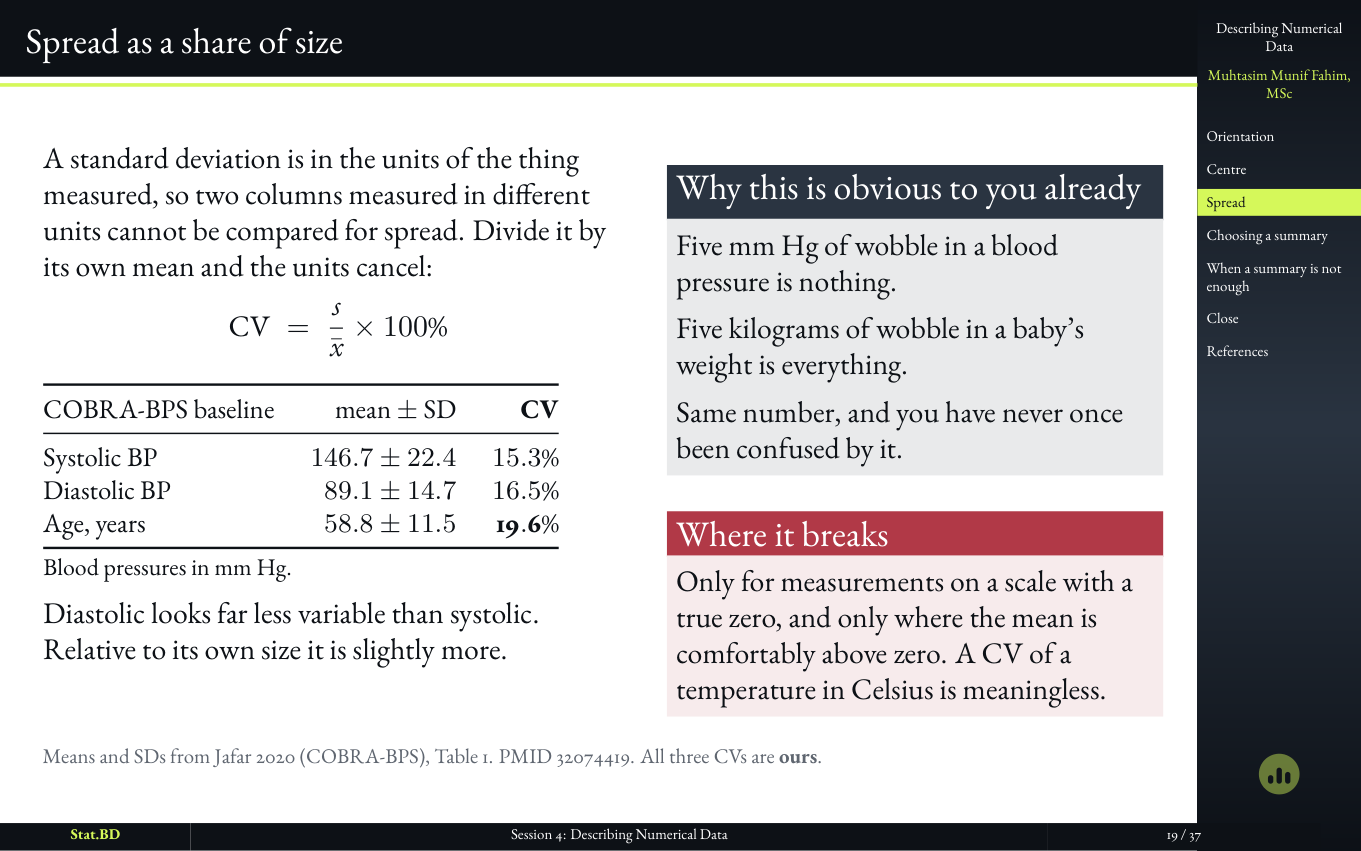
  8. Session 4, Act II · How spread out it is: Spread as a share of size.

    Slide 19

    Spread as a share of size

  9. Session 4, Act II · How spread out it is: Where the standard deviation comes from, without the algebra.

    Slide 20

    Where the standard deviation comes from, without the algebra

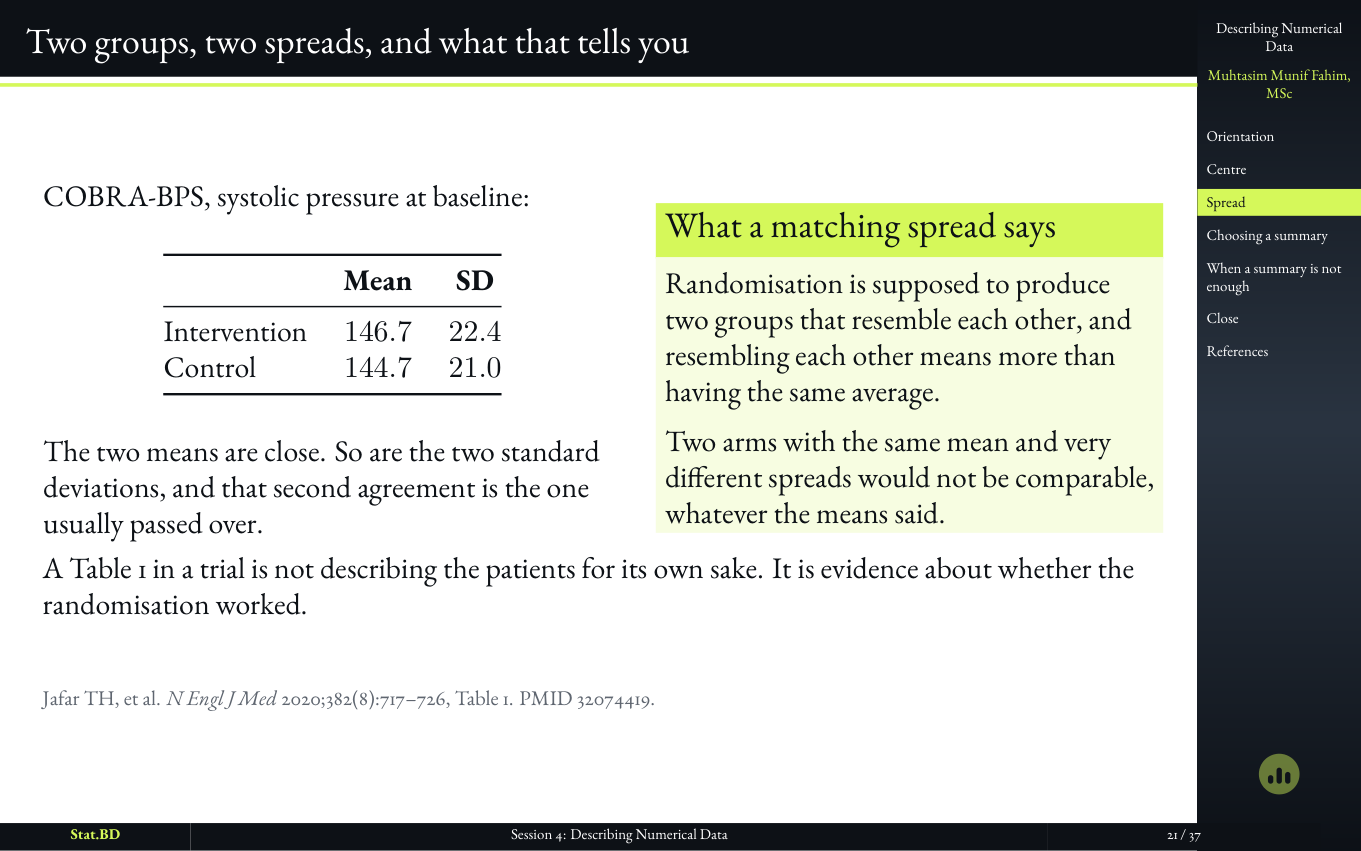
  10. Session 4, Act II · How spread out it is: Two groups, two spreads, and what that tells you.

    Slide 21

    Two groups, two spreads, and what that tells you

  11. Slide distinguishing standard deviation from standard error.

    Slide 22

    Standard deviation is not standard error

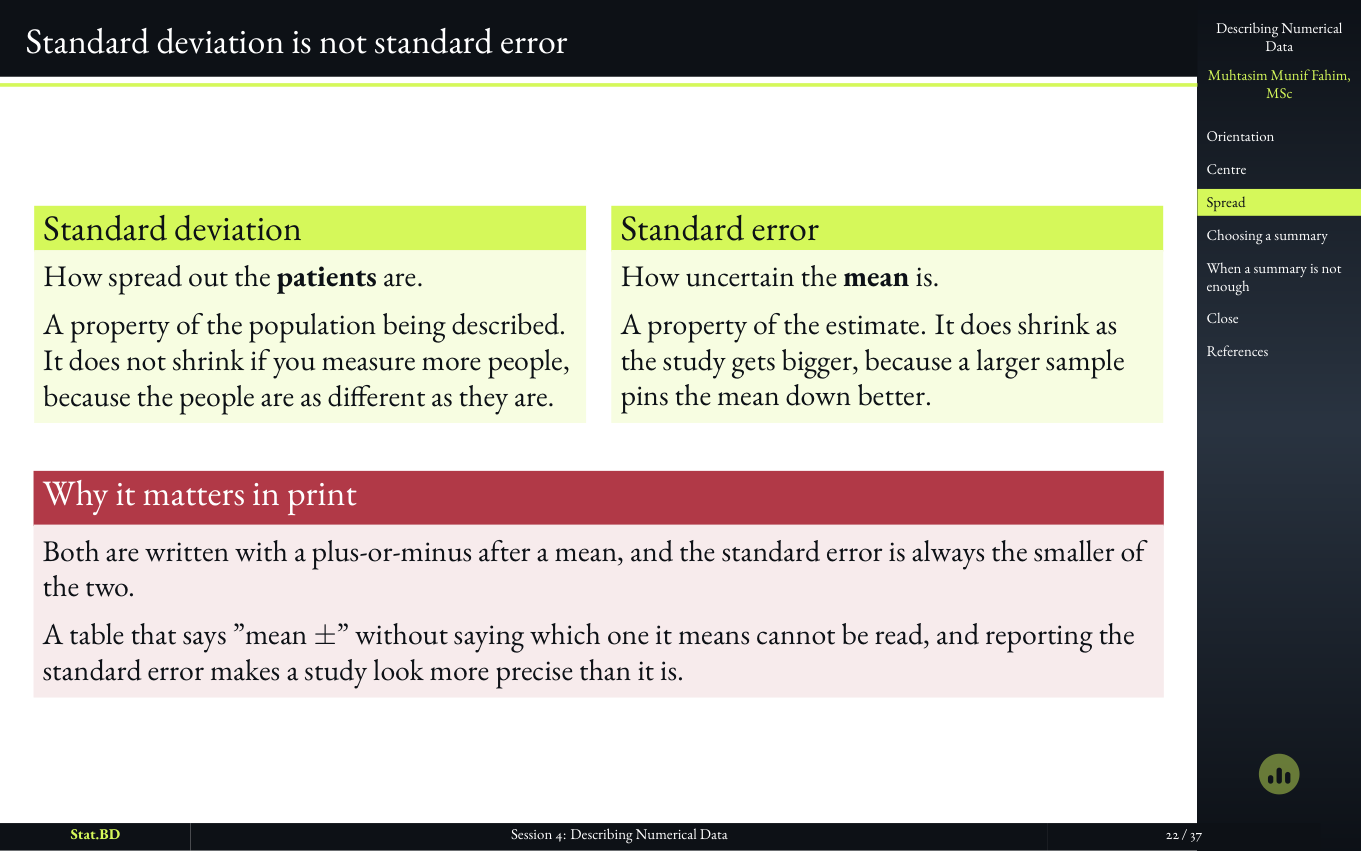
    One describes how spread out the people are. The other describes how unstable the mean would be in another sample. Mixing them is the most expensive confusion in a Table 1, and it is named here so Session 7 can own the second one properly.

8 slides

Act III · Choosing, and the Answer to the Puzzle We Opened With

  1. Session 4, Act III · Choosing, and the answer to the puzzle we opened with: Act III · Choosing, and the answer to the puzzle we opened with.

    Slide 23

    Act III · Choosing, and the Answer to the Puzzle We Opened With
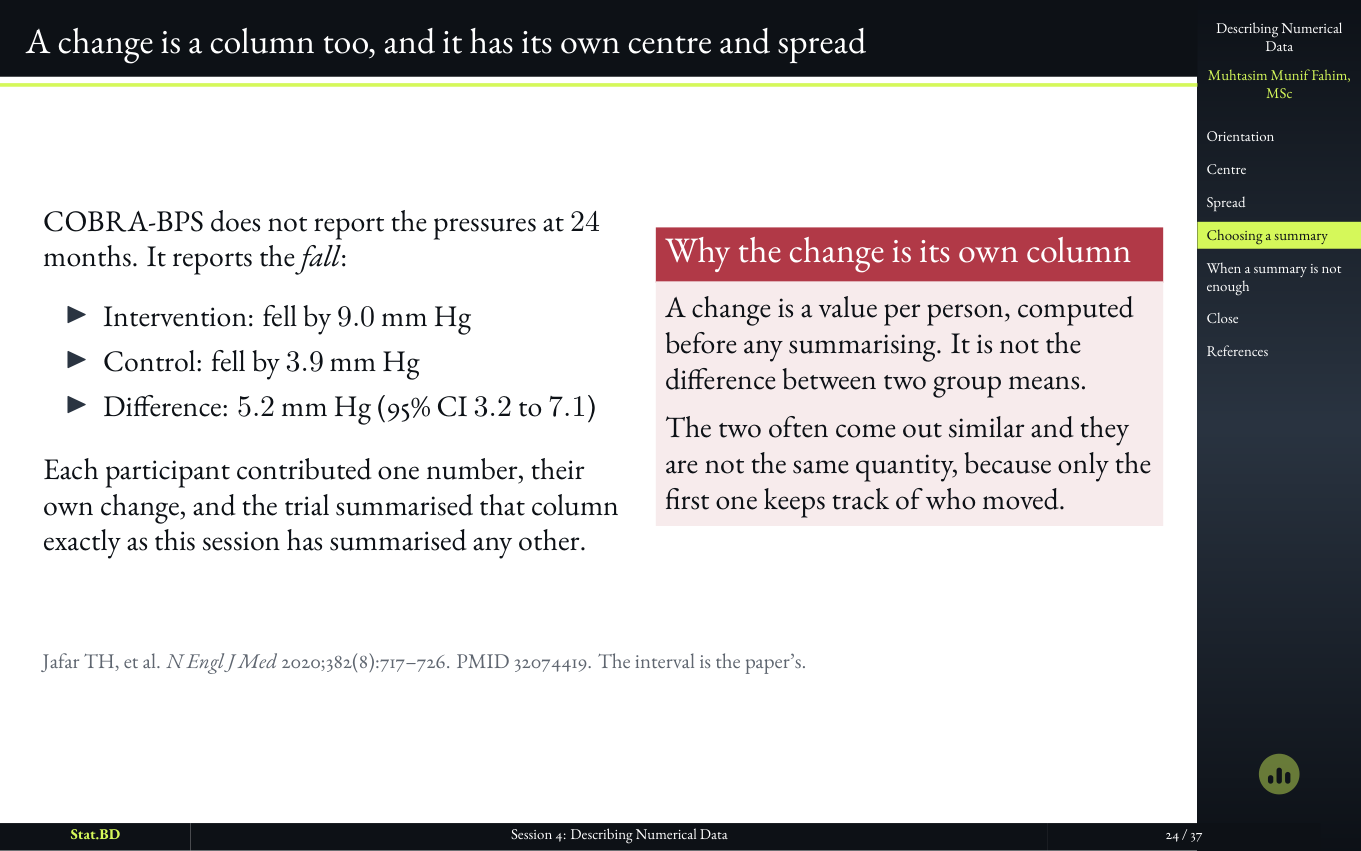
  2. Session 4, Act III · Choosing, and the answer to the puzzle we opened with: A change is a column too, and it has its own center and spread.

    Slide 24

    A change is a column too, and it has its own center and spread

  3. Slide showing that the choice of mean or median can be audited from the printed table alone.

    Slide 25

    You can audit the choice from the printed table alone

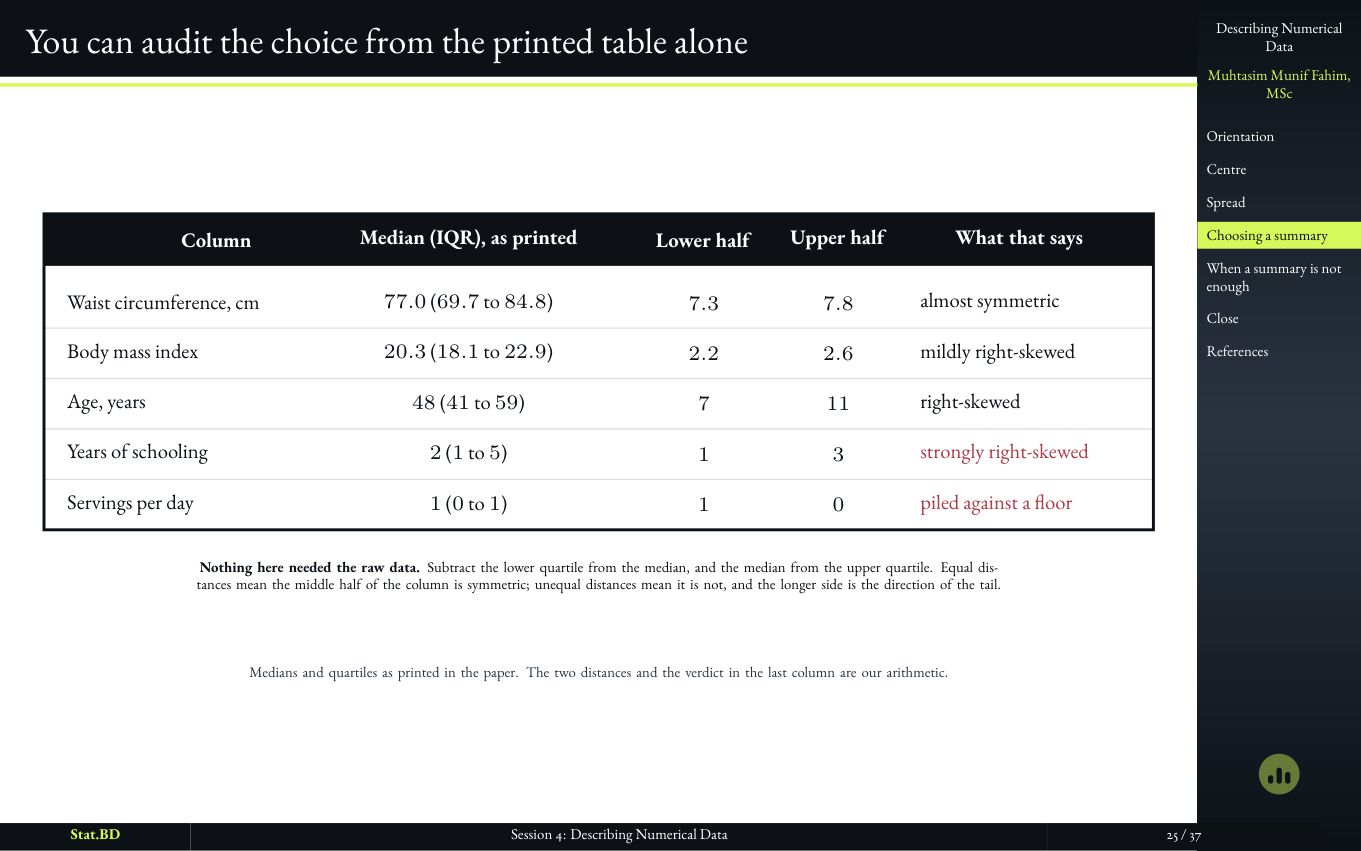
    You do not need the dataset. If a paper prints a mean and an SD for a column that must be skewed, the choice is already visible. Reading becomes checking, not trusting.

  4. Slide asking why the Sylhet paper never printed a mean.

    Slide 26

    So why did the Sylhet paper never print a mean?

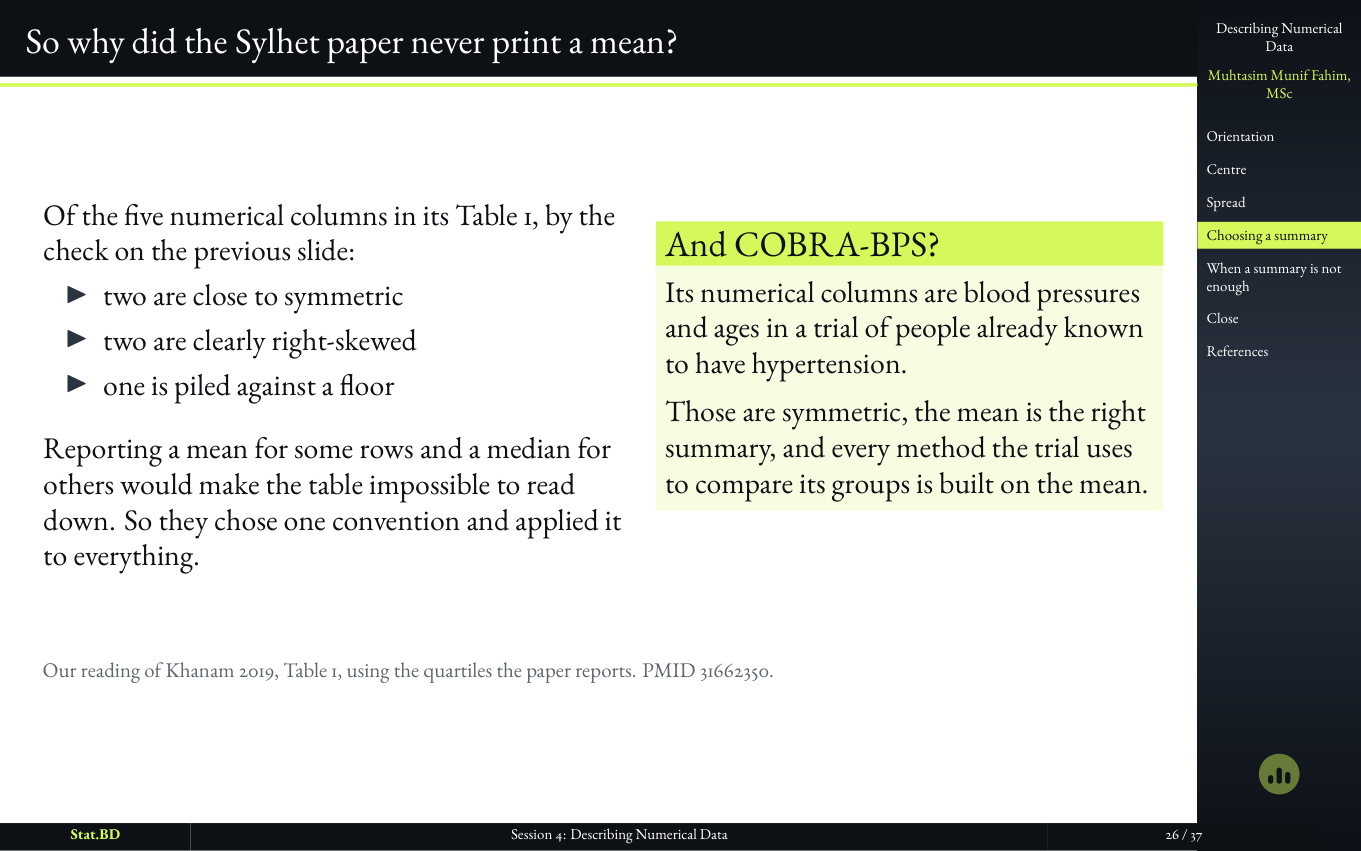
    The question the opening slide withheld. The answer is the shape of the columns, not a house style. Once you can see that from the printed numbers, you can say why a careful paper made the choice it made.

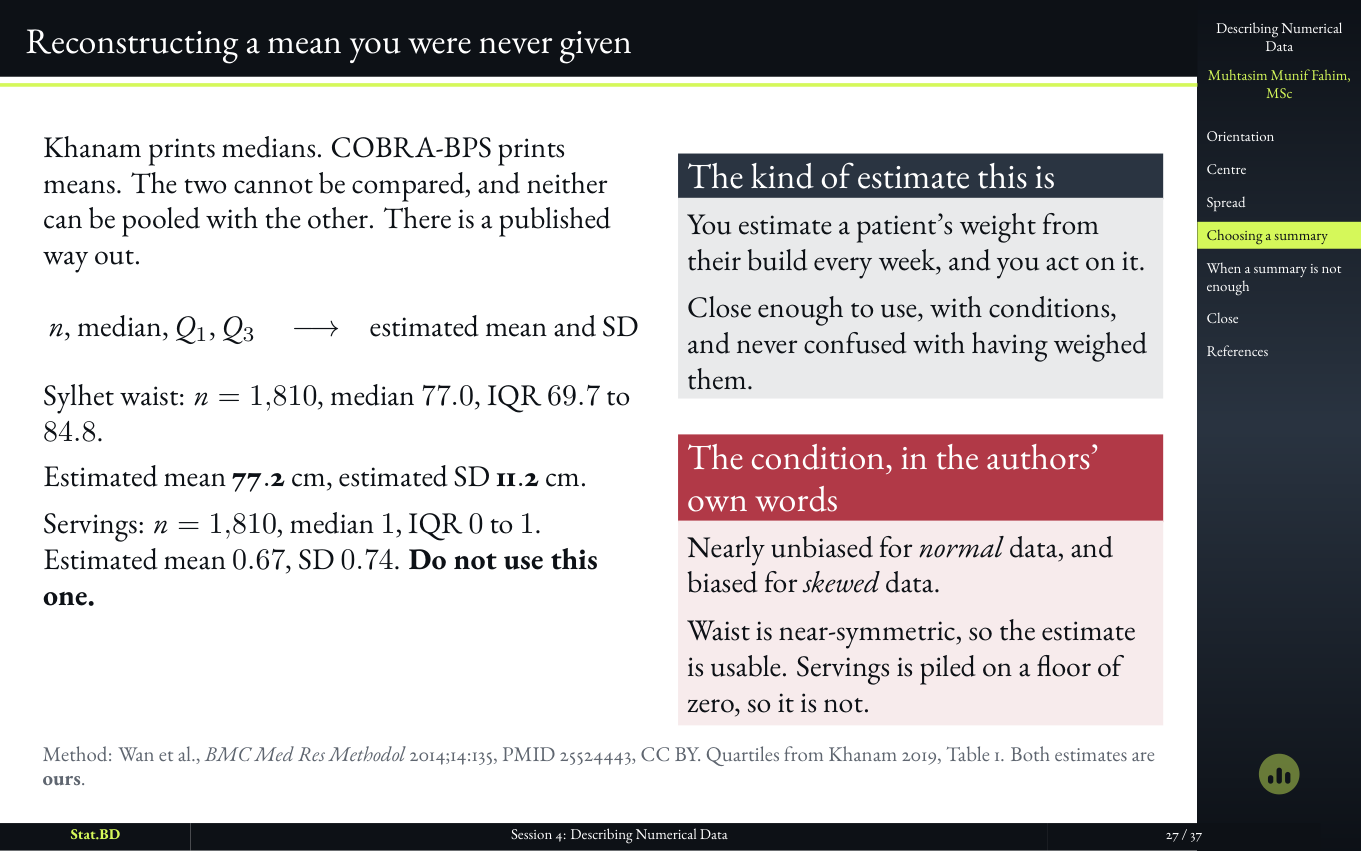
  5. Session 4, Act III · Choosing, and the answer to the puzzle we opened with: Reconstructing a mean you were never given.

    Slide 27

    Reconstructing a mean you were never given

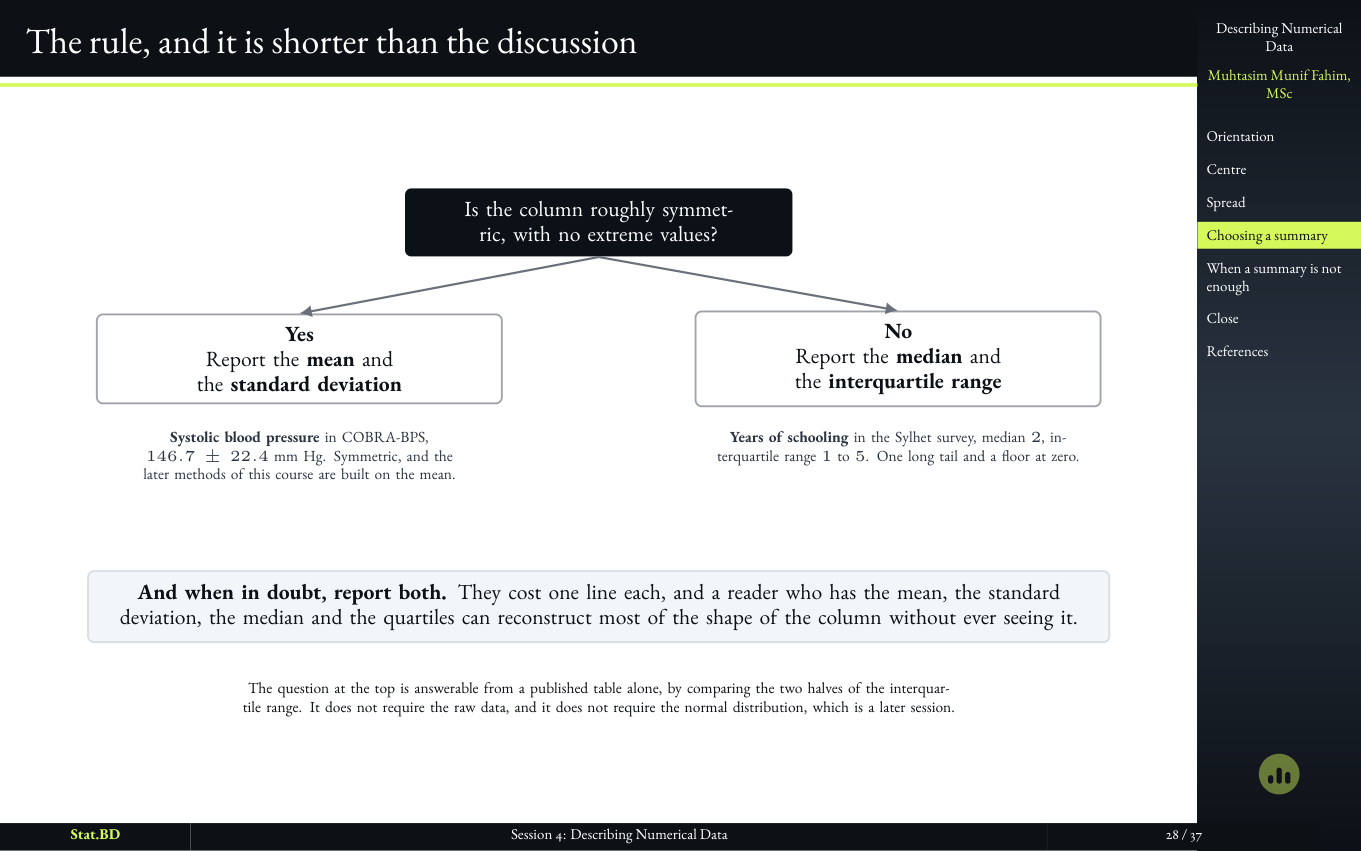
  6. Slide stating a short rule for choosing a mean or a median.

    Slide 28

    The rule, and it is shorter than the discussion

    Mean and SD when the column can support them. Median and IQR when it cannot. The long discussion exists so the short rule is believed, not so it can be replaced by a slogan.

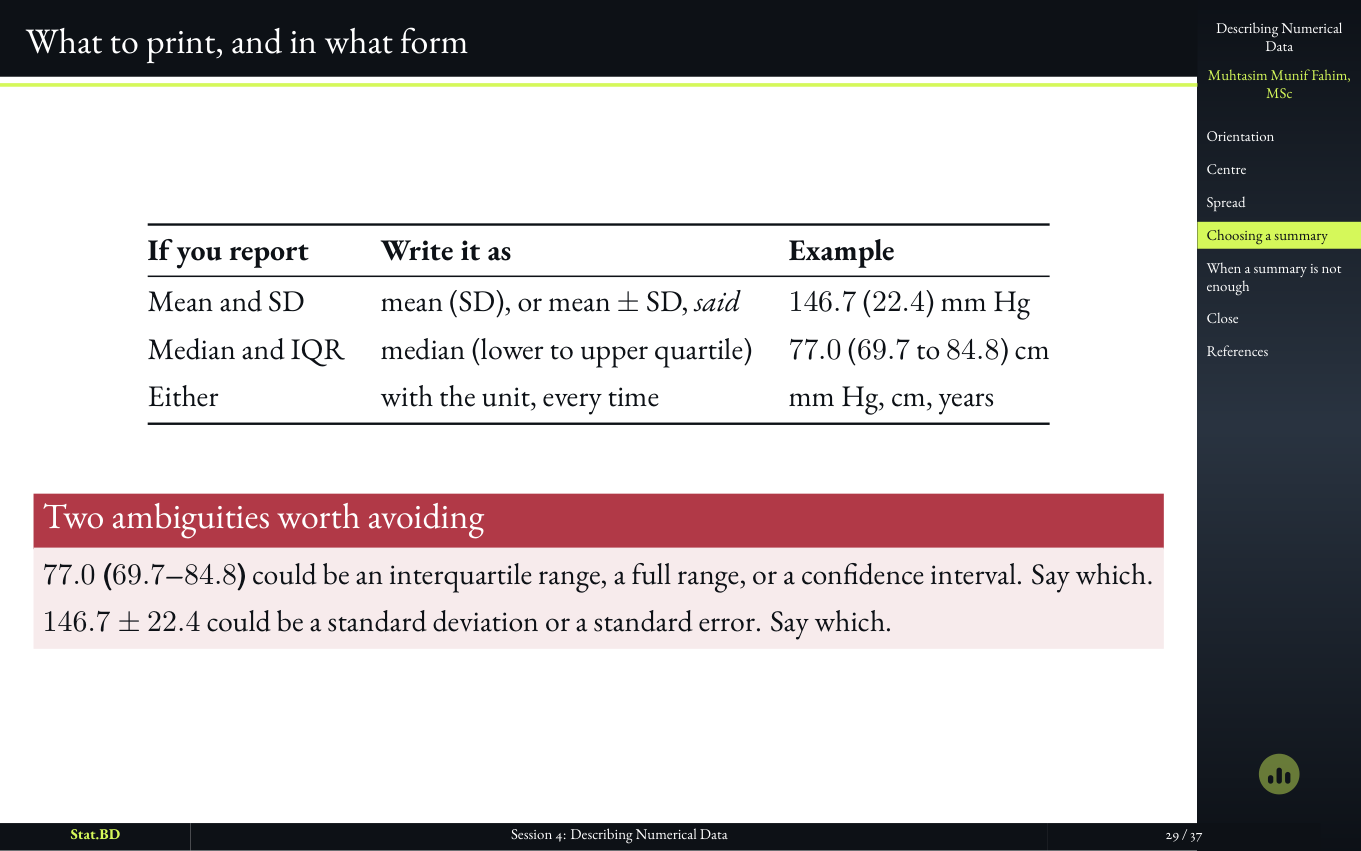
  7. Slide on what to print and in what form.

    Slide 29

    What to print, and in what form

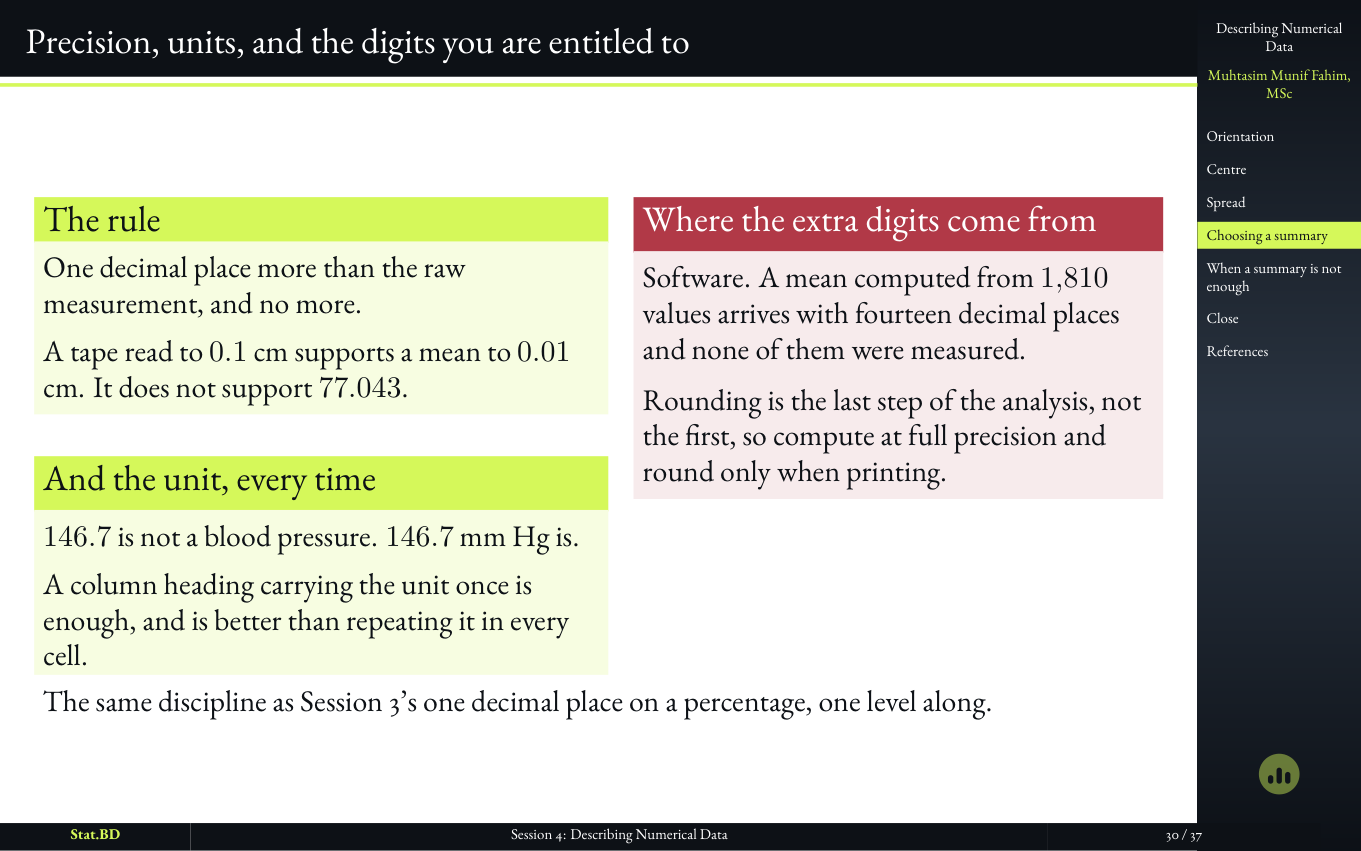
    Precision, units, and the digits you are entitled to. A summary that cannot be true is worse than no summary. Session 5 then owns the shape behind the choice; today only decides which pair of numbers leaves the room.

  8. Session 4, Act III · Choosing, and the answer to the puzzle we opened with: Precision, units, and the digits you are entitled to.

    Slide 30

    Precision, units, and the digits you are entitled to

5 slides

Act IV · When One Number Will Not Do the Job
  1. Session 4, Act IV · When one number will not do the job: Act IV · When one number will not do the job.

    Slide 31

    Act IV · When One Number Will Not Do the Job
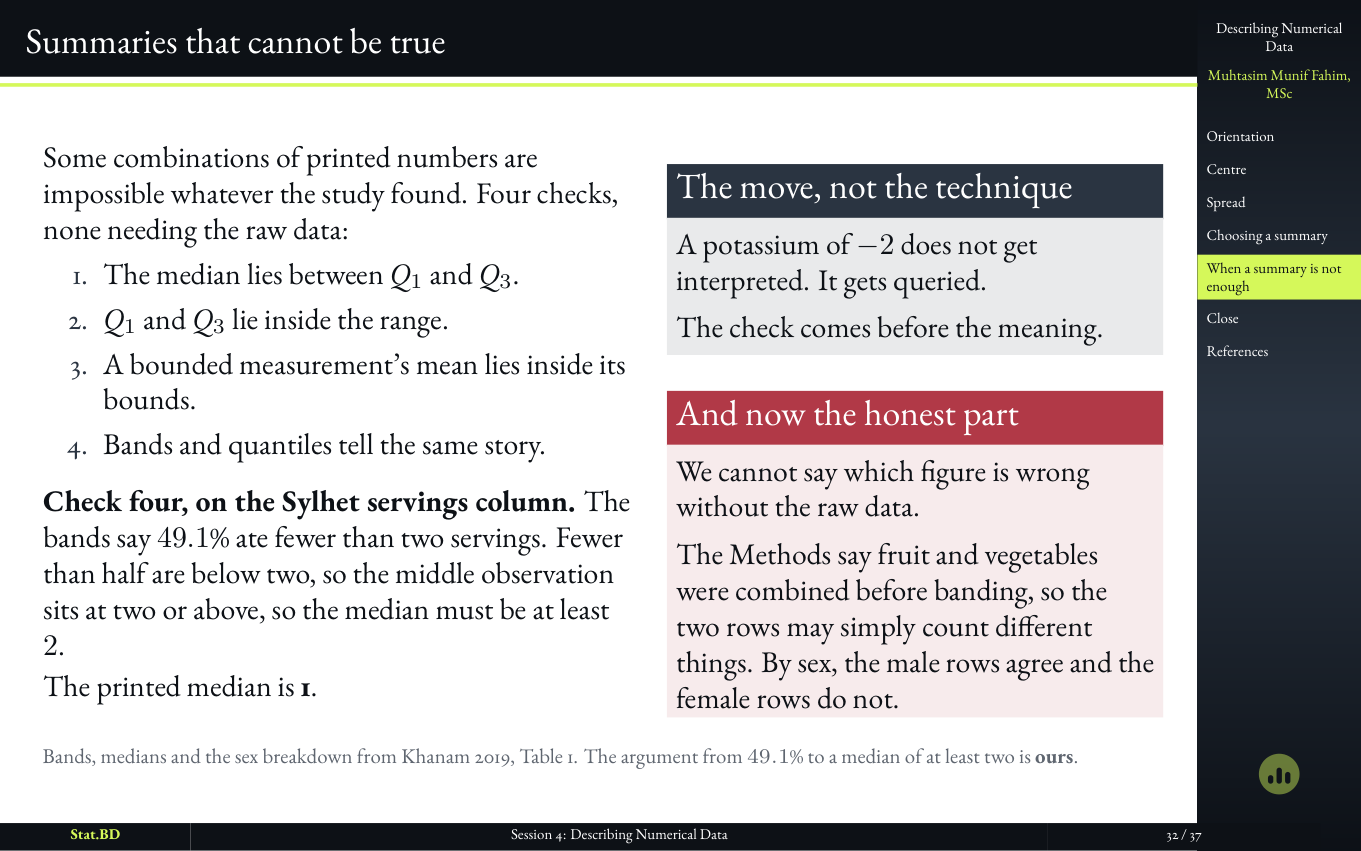
  2. Session 4, Act IV · When one number will not do the job: Summaries that cannot be true.

    Slide 32

    Summaries that cannot be true

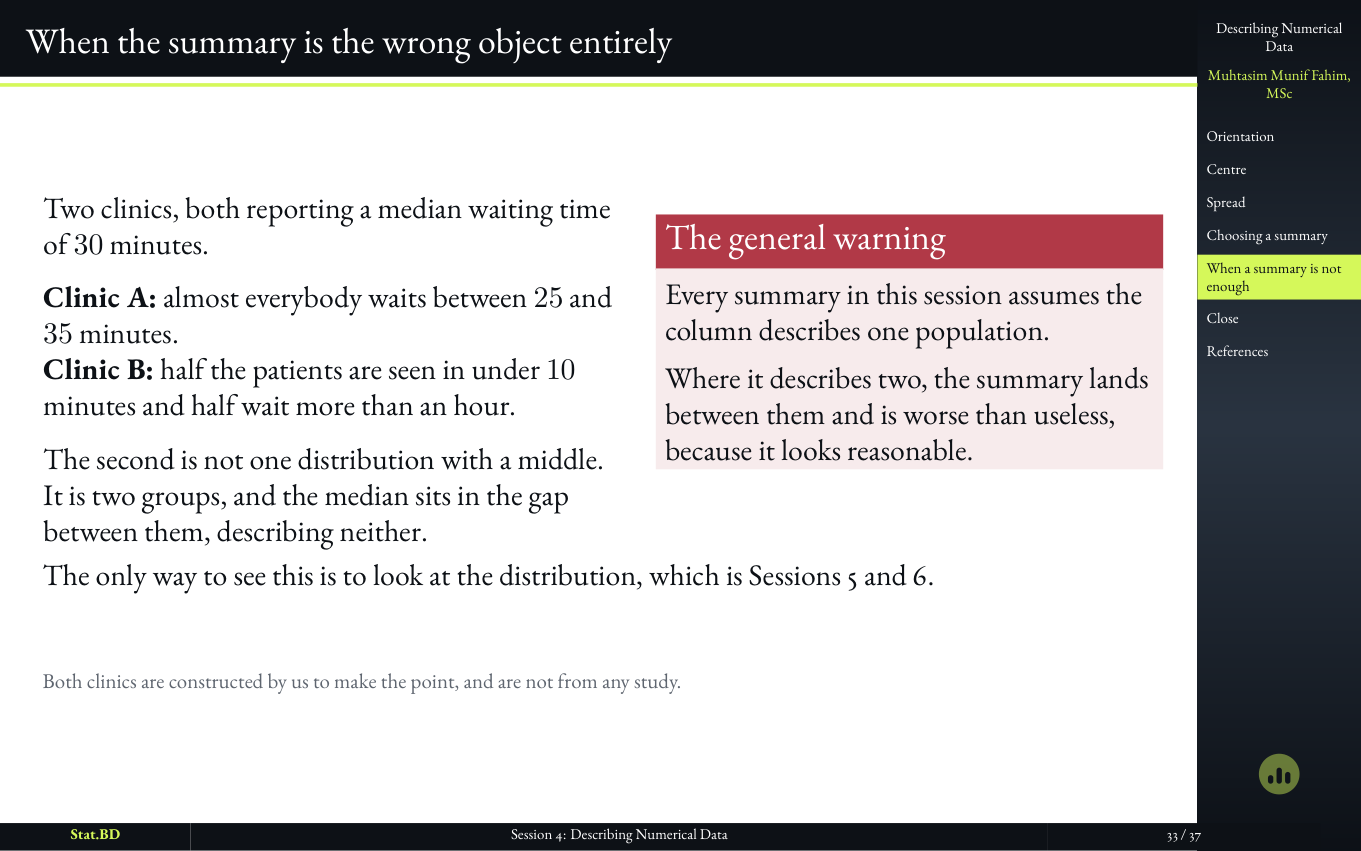
  3. Session 4, Act IV · When one number will not do the job: When the summary is the wrong object entirely.

    Slide 33

    When the summary is the wrong object entirely

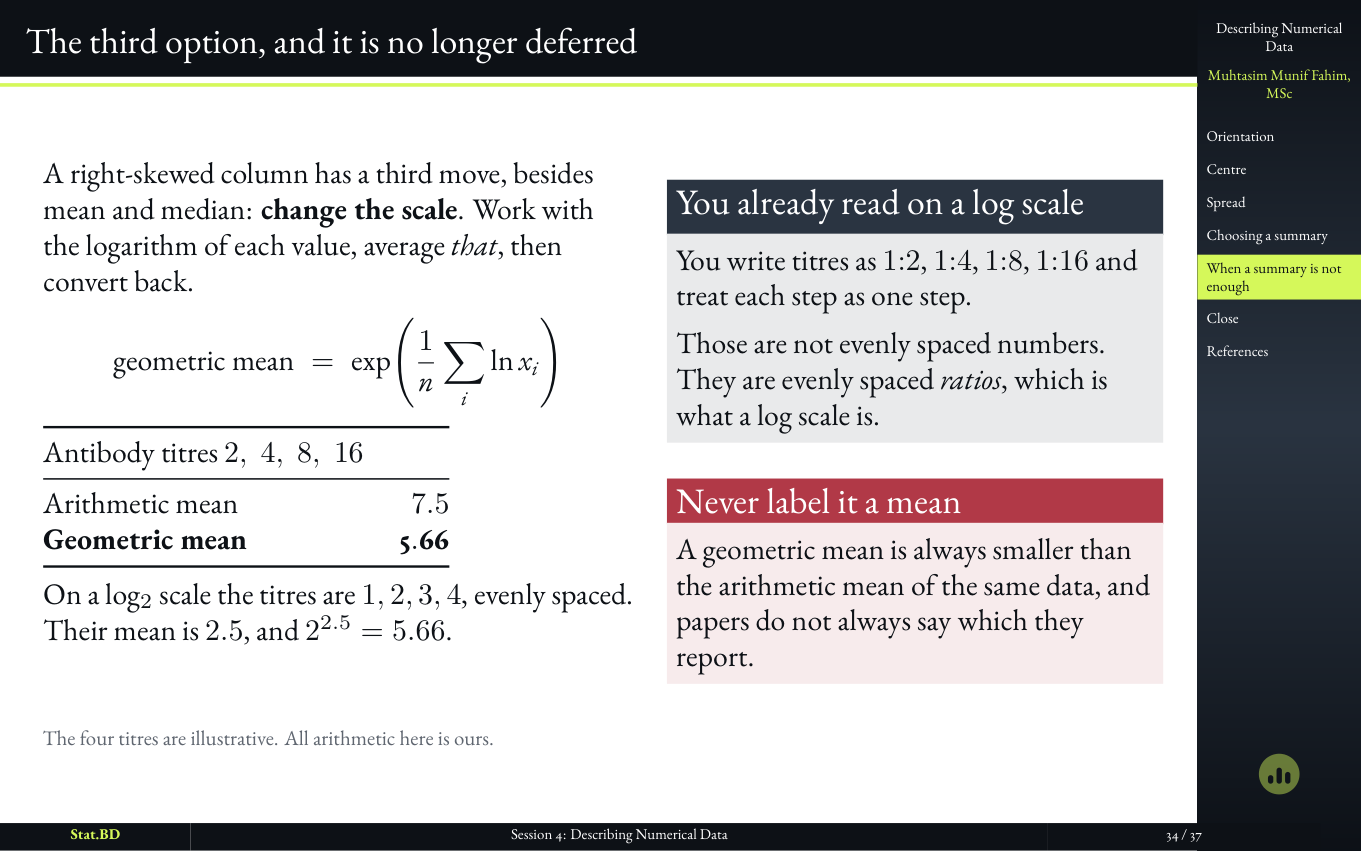
  4. Session 4, Act IV · When one number will not do the job: The third option, and it is no longer deferred.

    Slide 34

    The third option, and it is no longer deferred

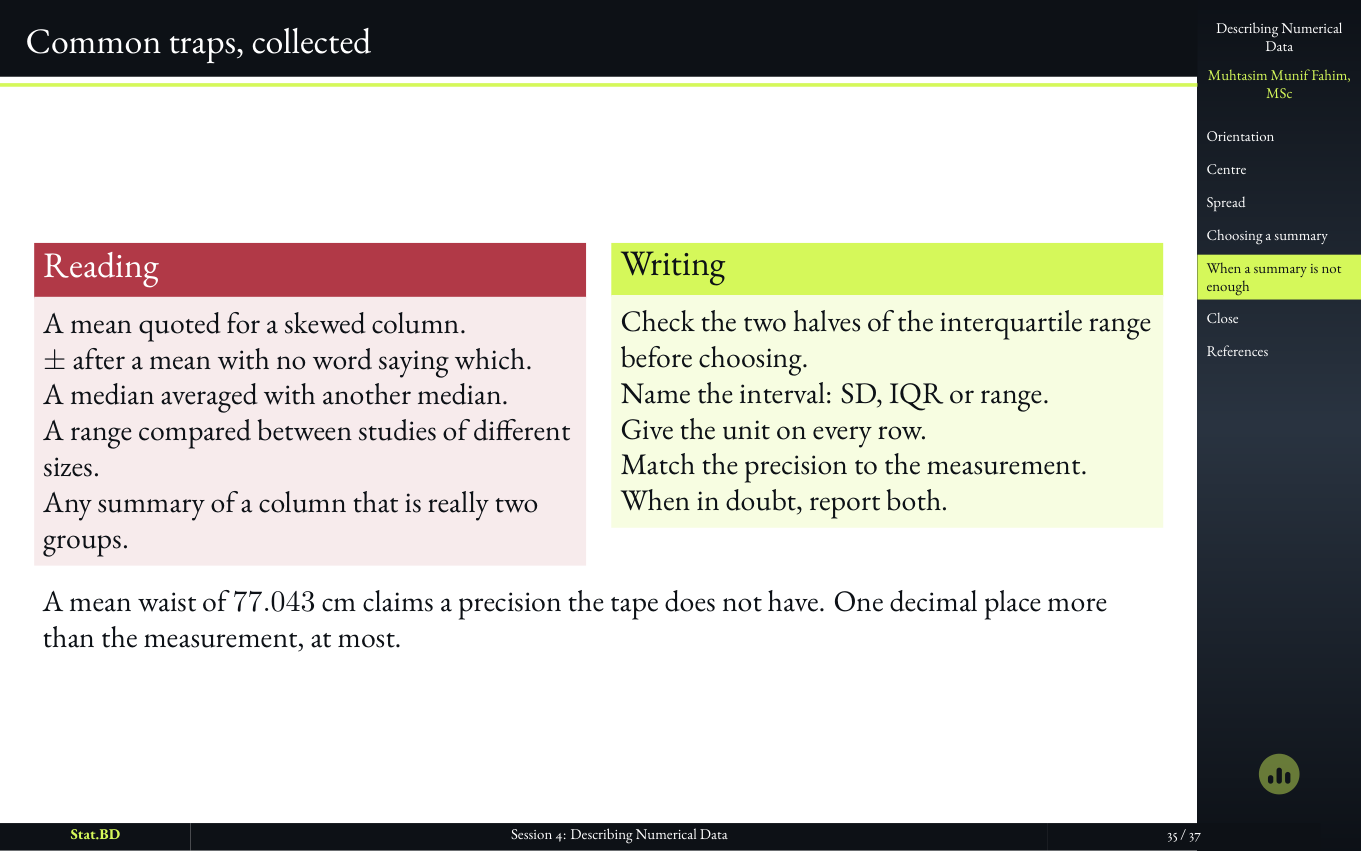
  5. Session 4, Act IV · When one number will not do the job: Common traps, collected.

    Slide 35

    Common traps, collected

2 slides

Close

  1. Session 4, Close: Close.

    Slide 36

    Close

  2. Session 4, Close: Before the next session.

    Slide 37

    Before the next session

Named and stopped

What We Deliberately Did Not Teach Yet.

  • The shape of a column, and when it is skewed enough (Session 5).
  • Standard error and sampling variability (Session 7).
  • The 1.5 × IQR outlier rule (Session 5).

Where this goes

Session 5: Understanding Distributions & Outliers

Later sessions are planned, not published. Request a plan if you want the same kind of class for your own work.