সেশন ৩.৫

Excel-এ ডেটা নিয়ে কাজ

এতদিন যত সংখ্যা দেখেছেন, এবার নিজেই বানাবেন

১০০ মিনিট · ৫টি পর্বে ৩৪টি স্লাইড · স্লাইড ও নোট ইংরেজিতে

৩টি স্লাইড

Orientation

  1. Session 3.5 title slide: Working with Data in Excel.

    স্লাইড ১

    Working With Data in Excel

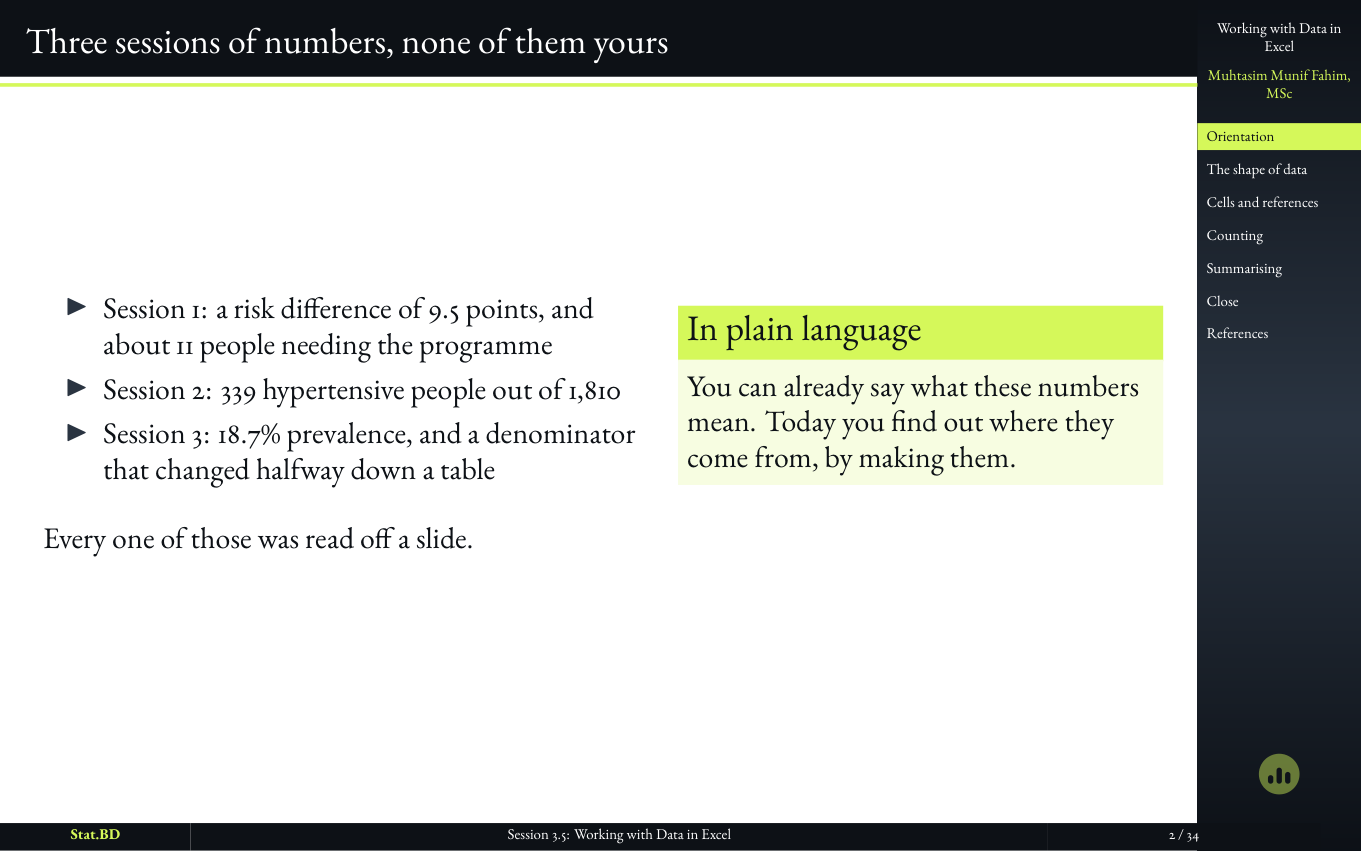
  2. Slide stating that three sessions of numbers had been shown but none produced by the student.

    স্লাইড ২

    Three sessions of numbers, none of them yours

    The risk difference, the hypertensive counts, the percentages: all printed, none typed. A mentorship plan that cannot insert a lab here is a syllabus, not a room.

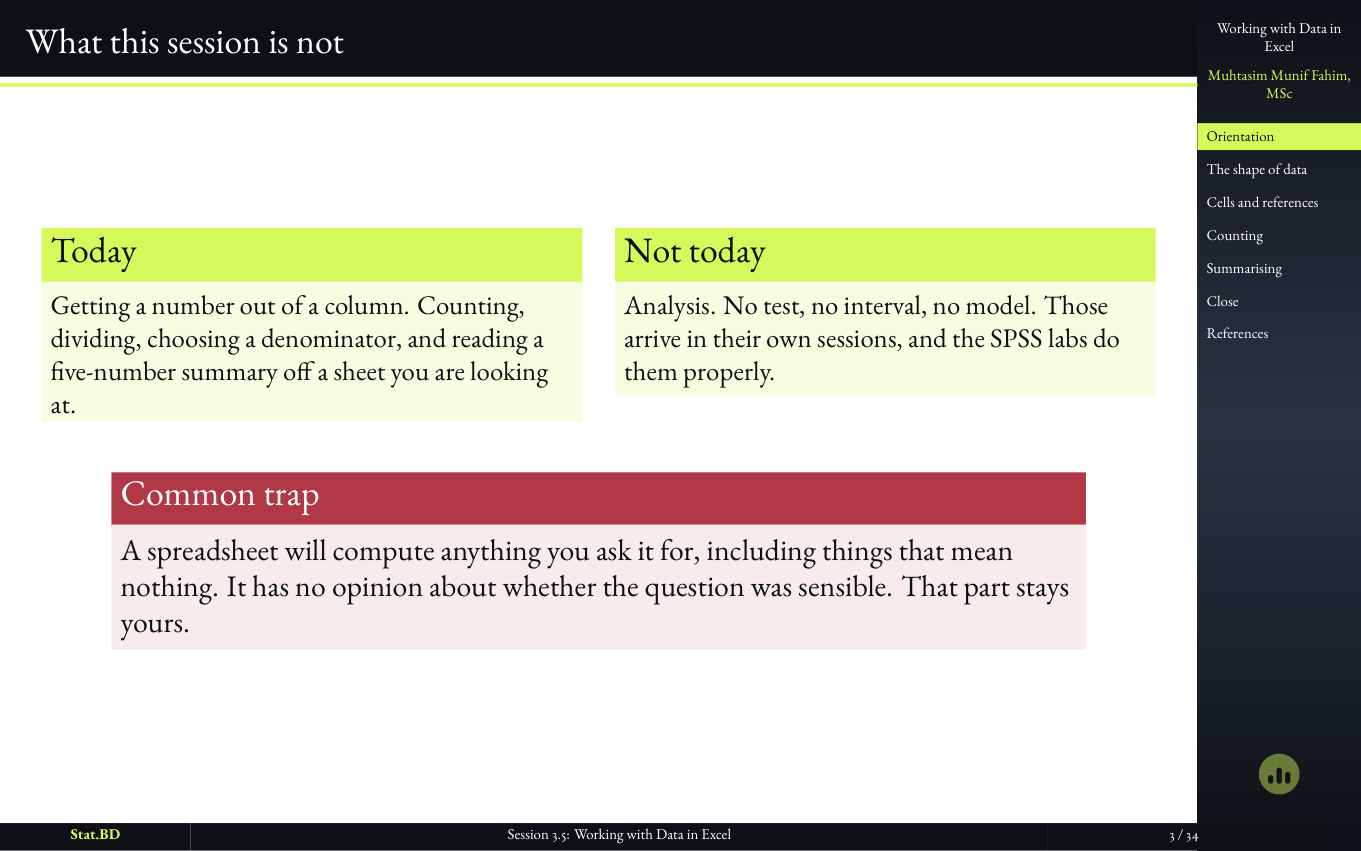
  3. Slide stating what the Excel session is not.

    স্লাইড ৩

    What this session is not

    It is not an Excel course. It is not a new paper. It is the earlier numbers, made rather than received, so the next session can talk about means and medians with a student who has already produced both.

৭টি স্লাইড

Act I · A Sheet Is a Dataset, Not a Report

  1. Session 3.5, Act I · A sheet is a dataset, not a report: Act I · A sheet is a dataset, not a report.

    স্লাইড ৪

    Act I · A Sheet Is a Dataset, Not a Report
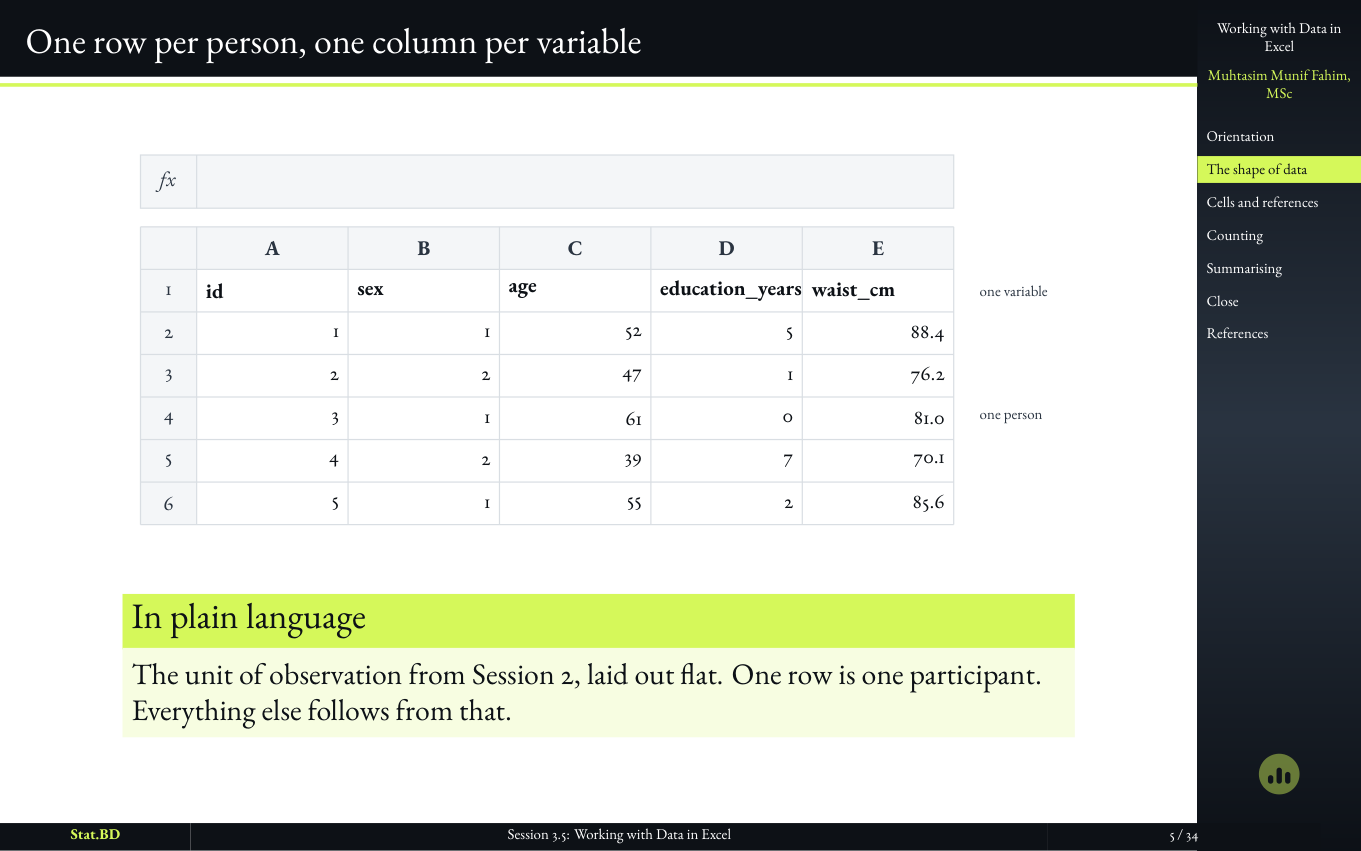
  2. Slide stating the rule of one row per person and one column per variable.

    স্লাইড ৫

    One row per person, one column per variable

    Session 2’s rectangle becomes a sheet. If that rule is broken, every later formula is decorating a mess.

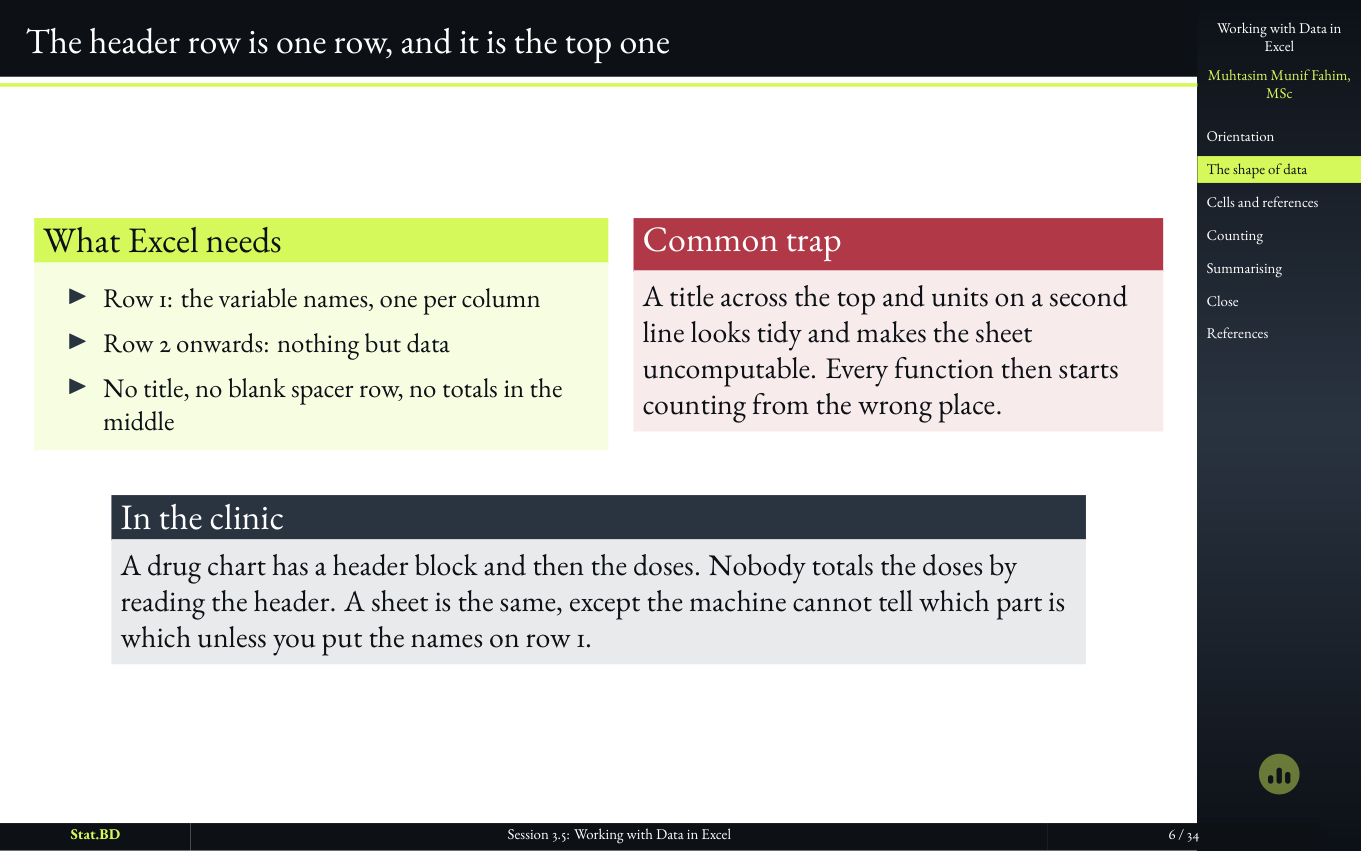
  3. Session 3.5, Act I · A sheet is a dataset, not a report: The header row is one row, and it is the top one.

    স্লাইড ৬

    The header row is one row, and it is the top one

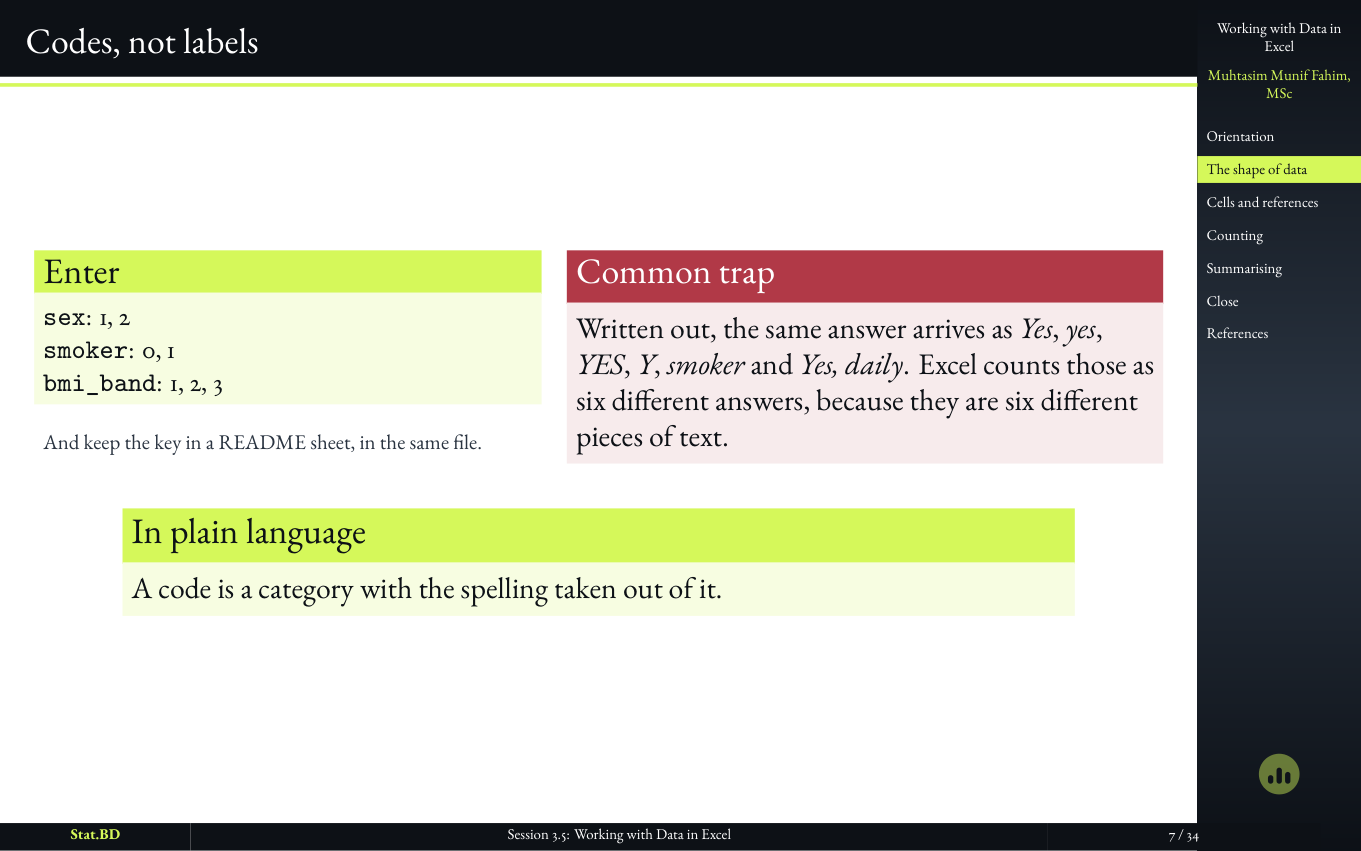
  4. Session 3.5, Act I · A sheet is a dataset, not a report: Codes, not labels.

    স্লাইড ৭

    Codes, not labels

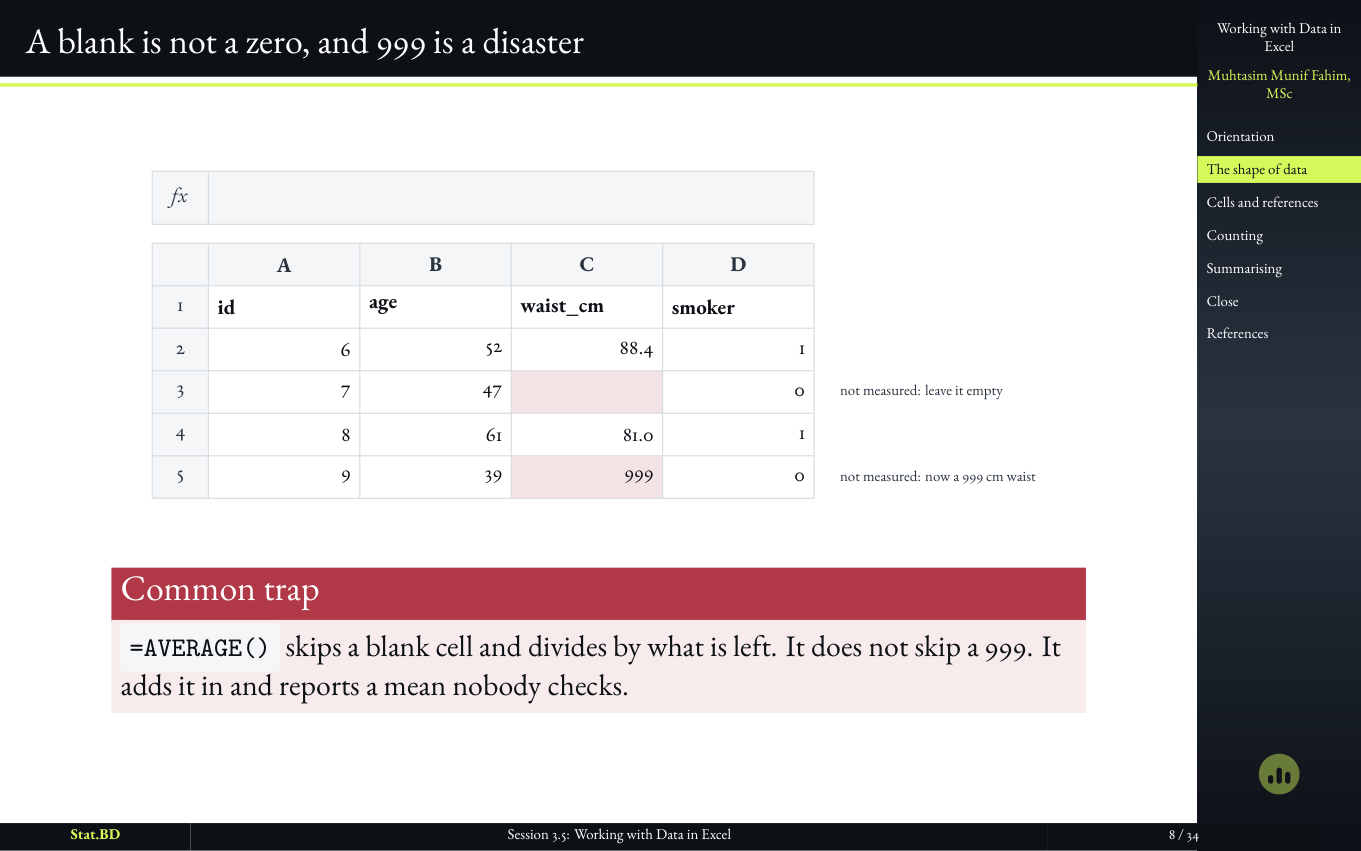
  5. Slide warning that a blank is not a zero and that 999 as a missing code is a disaster.

    স্লাইড ৮

    A blank is not a zero, and 999 is a disaster

    Missingness is a decision that has to stay visible. Filling it with zero invents patients. Coding it as 999 invents giants. Both destroy a mean before anyone has chosen a test.

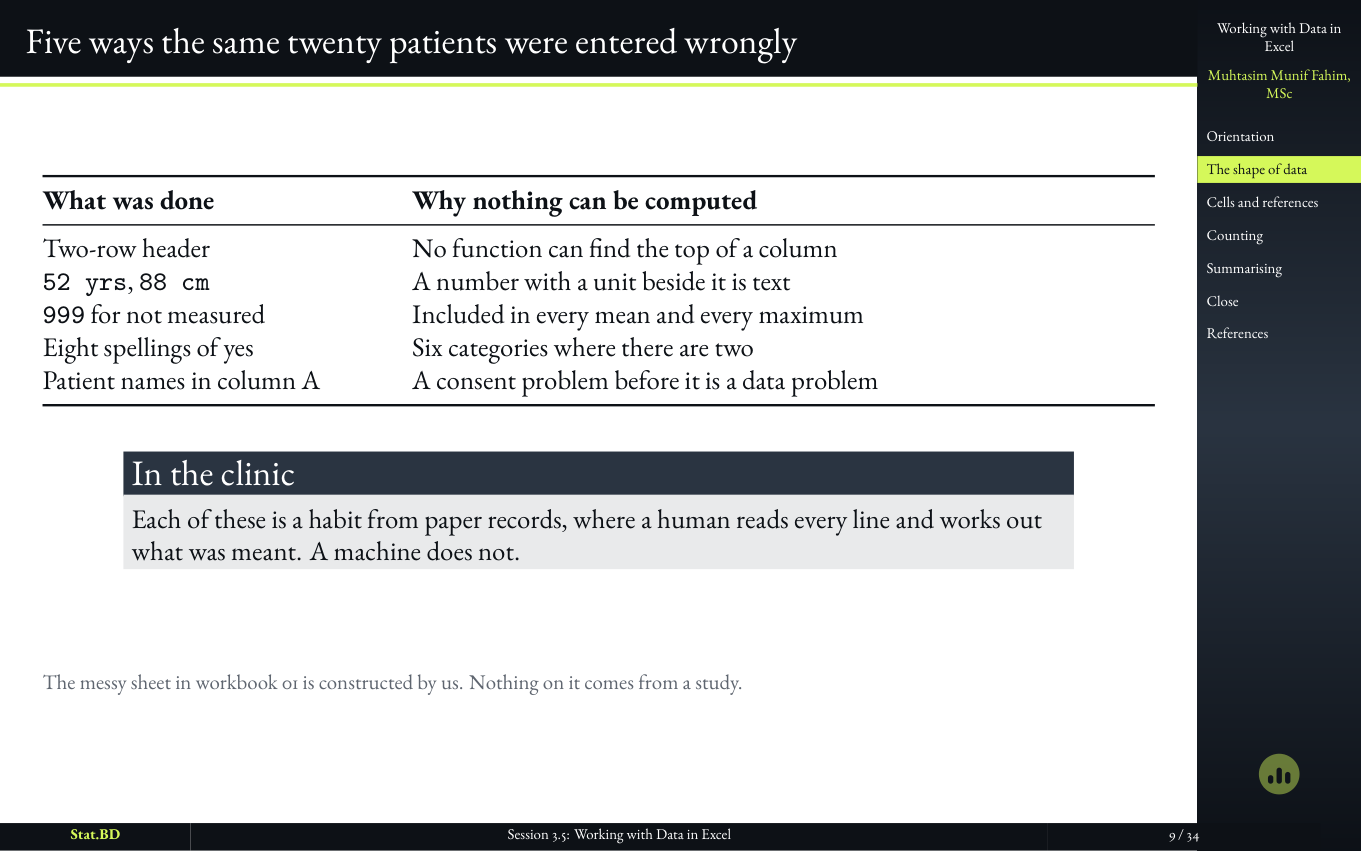
  6. Slide showing five ways the same twenty patients were entered wrongly.

    স্লাইড ৯

    Five ways the same twenty patients were entered wrongly

    The practice register is simulated and says so on the frame. The mistakes are not. They are the ones that quietly sit under a finished Table 1.

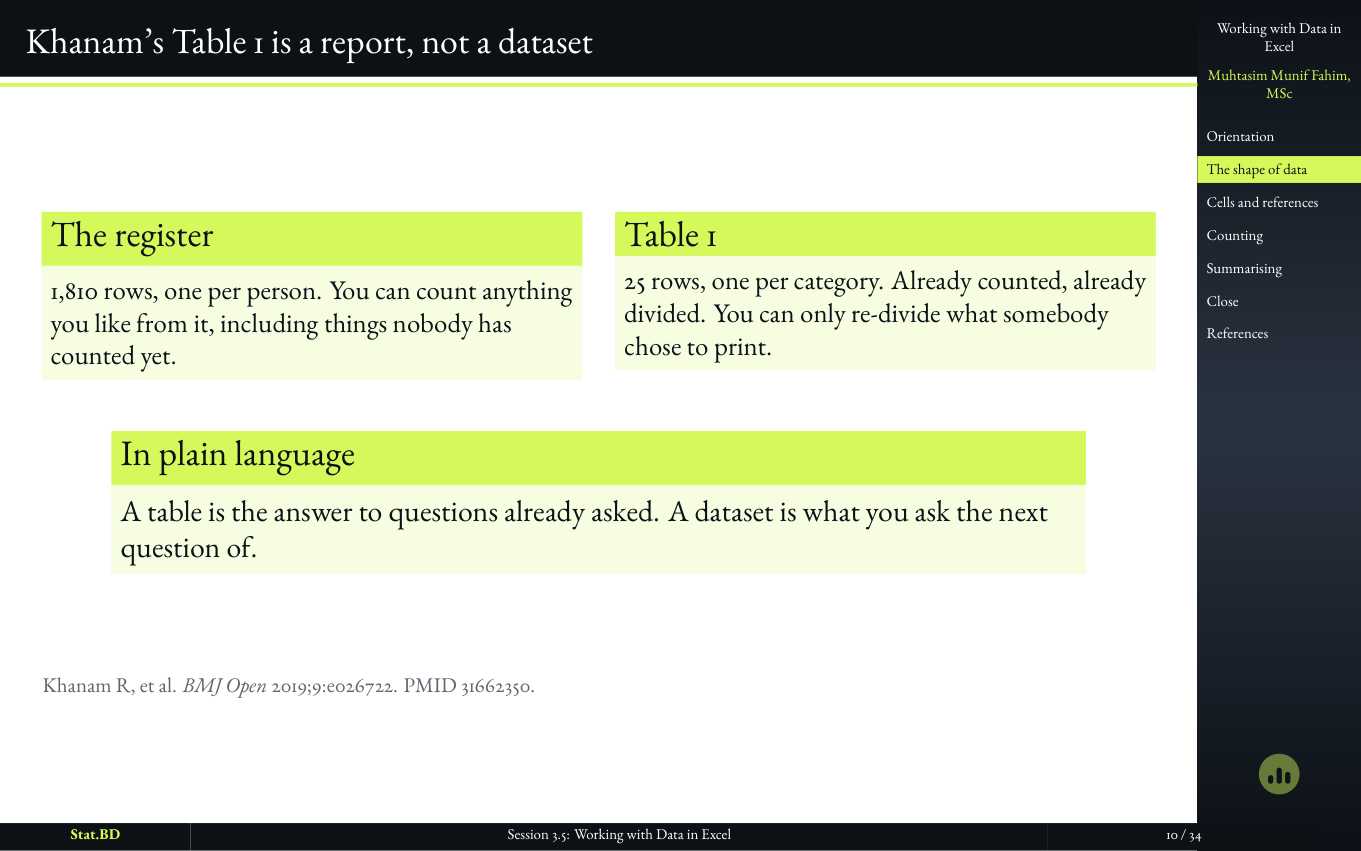
  7. Slide contrasting a patient register with a published Table 1.

    স্লাইড ১০

    Khanam’s Table 1 is a report, not a dataset

    A table is the answer to questions already asked. A dataset is what you ask the next question of. Confusing the two is how people try to ‘analyze’ a published table and think they have the study.

৭টি স্লাইড

Act II · Addresses, Formulas, and the Denominator That Moved
  1. Session 3.5, Act II · Addresses, formulas, and the denominator that moved: Act II · Addresses, formulas, and the denominator that moved.

    স্লাইড ১১

    Act II · Addresses, Formulas, and the Denominator That Moved
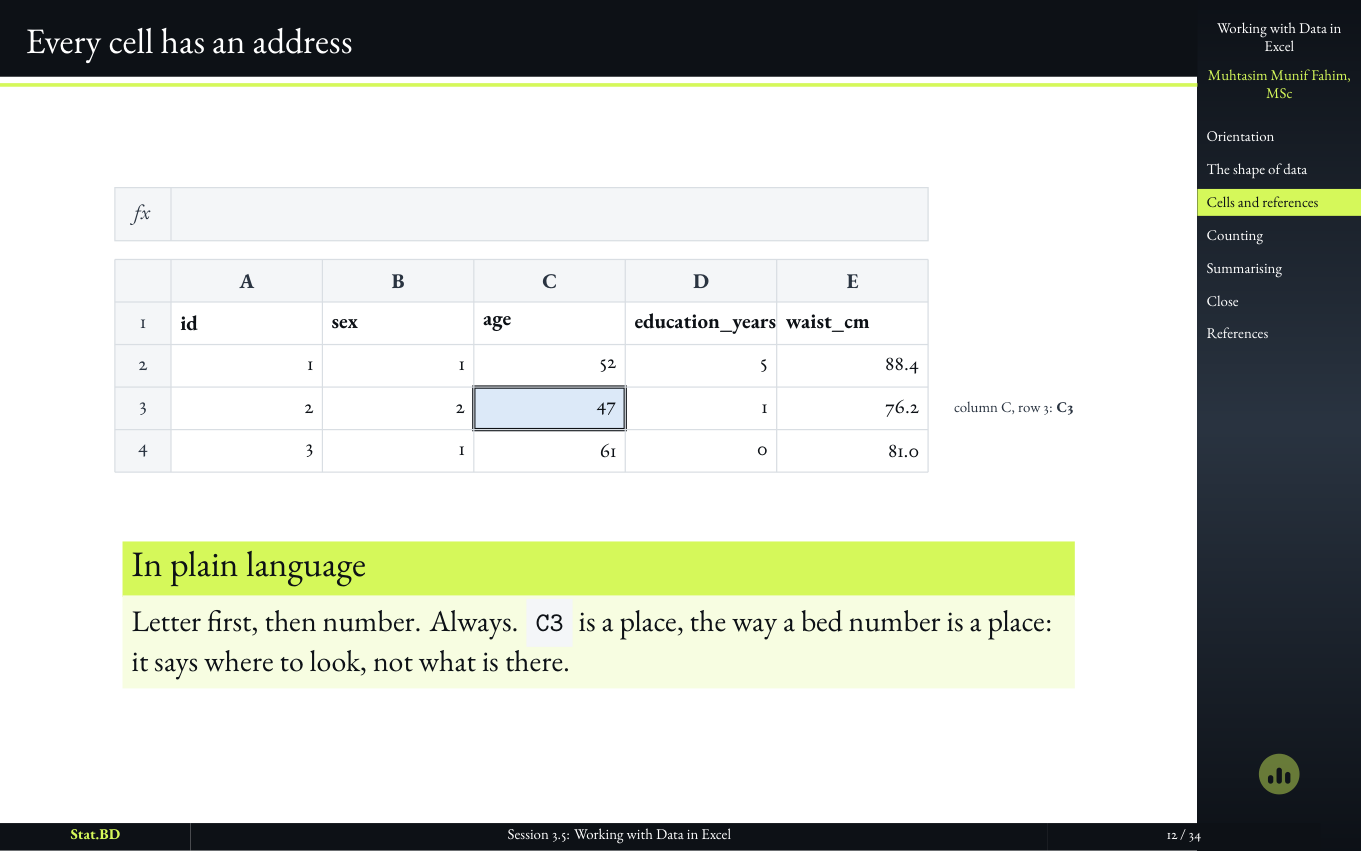
  2. Session 3.5, Act II · Addresses, formulas, and the denominator that moved: Every cell has an address.

    স্লাইড ১২

    Every cell has an address

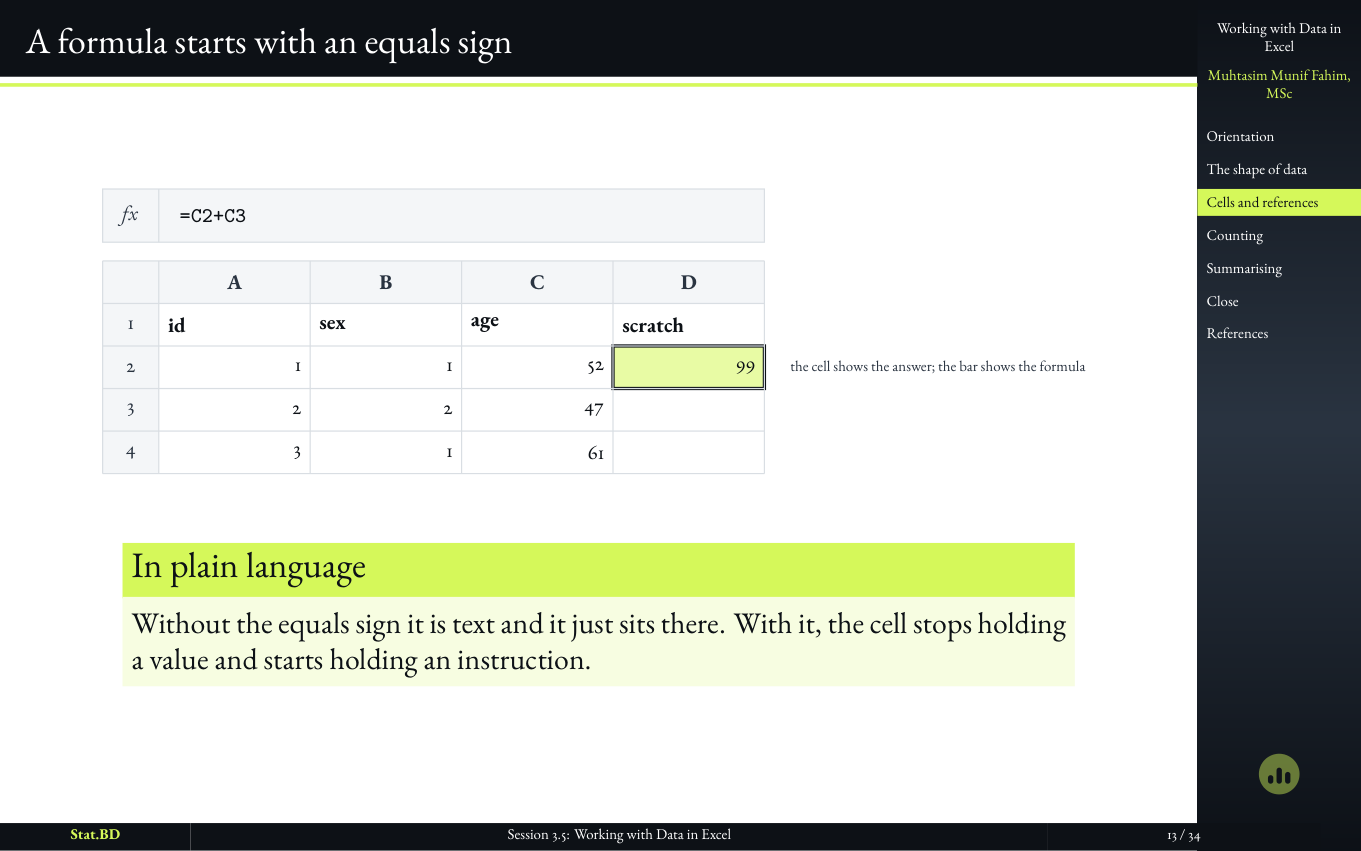
  3. Session 3.5, Act II · Addresses, formulas, and the denominator that moved: A formula starts with an equals sign.

    স্লাইড ১৩

    A formula starts with an equals sign

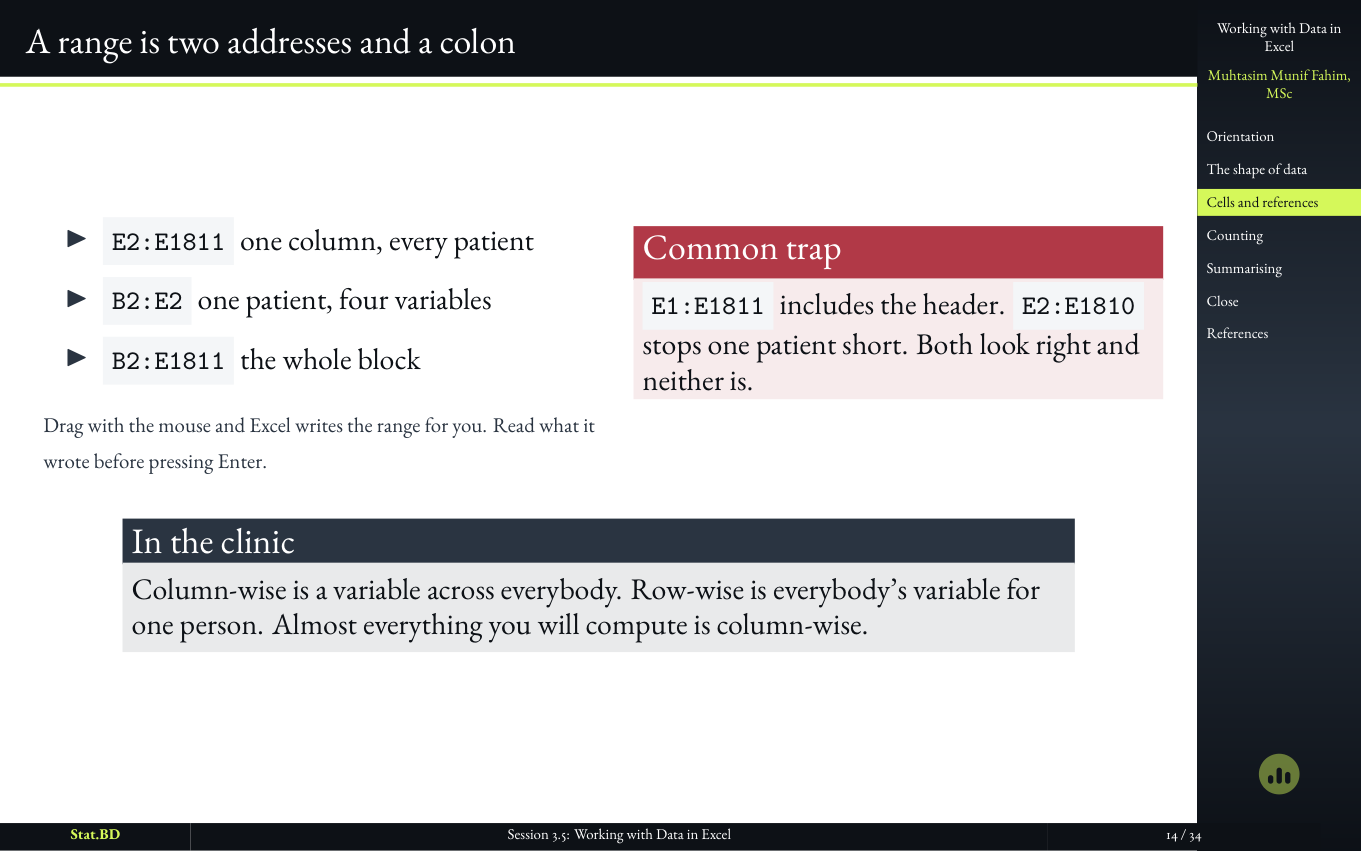
  4. Session 3.5, Act II · Addresses, formulas, and the denominator that moved: A range is two addresses and a colon.

    স্লাইড ১৪

    A range is two addresses and a colon

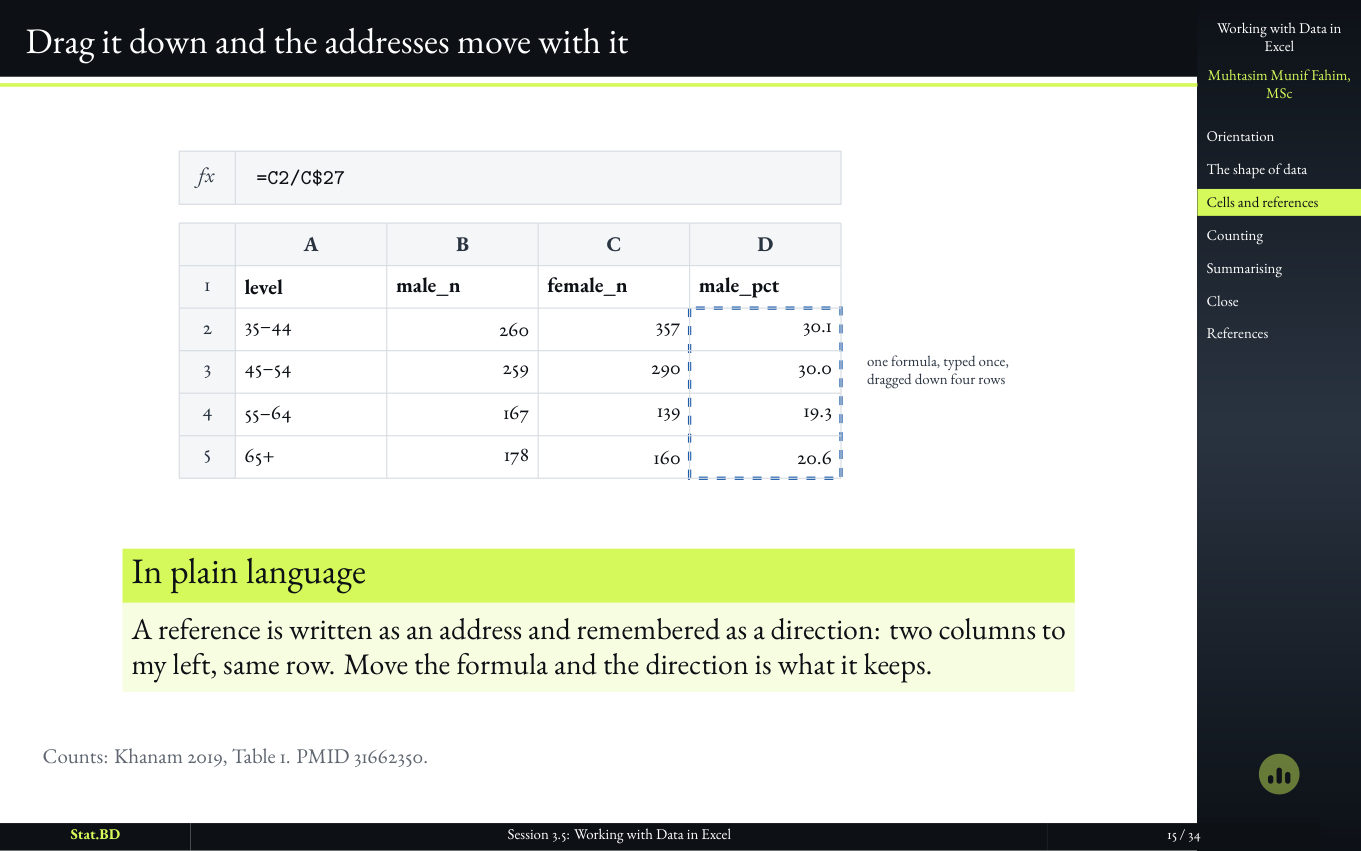
  5. Session 3.5, Act II · Addresses, formulas, and the denominator that moved: Drag it down and the addresses move with it.

    স্লাইড ১৫

    Drag it down and the addresses move with it

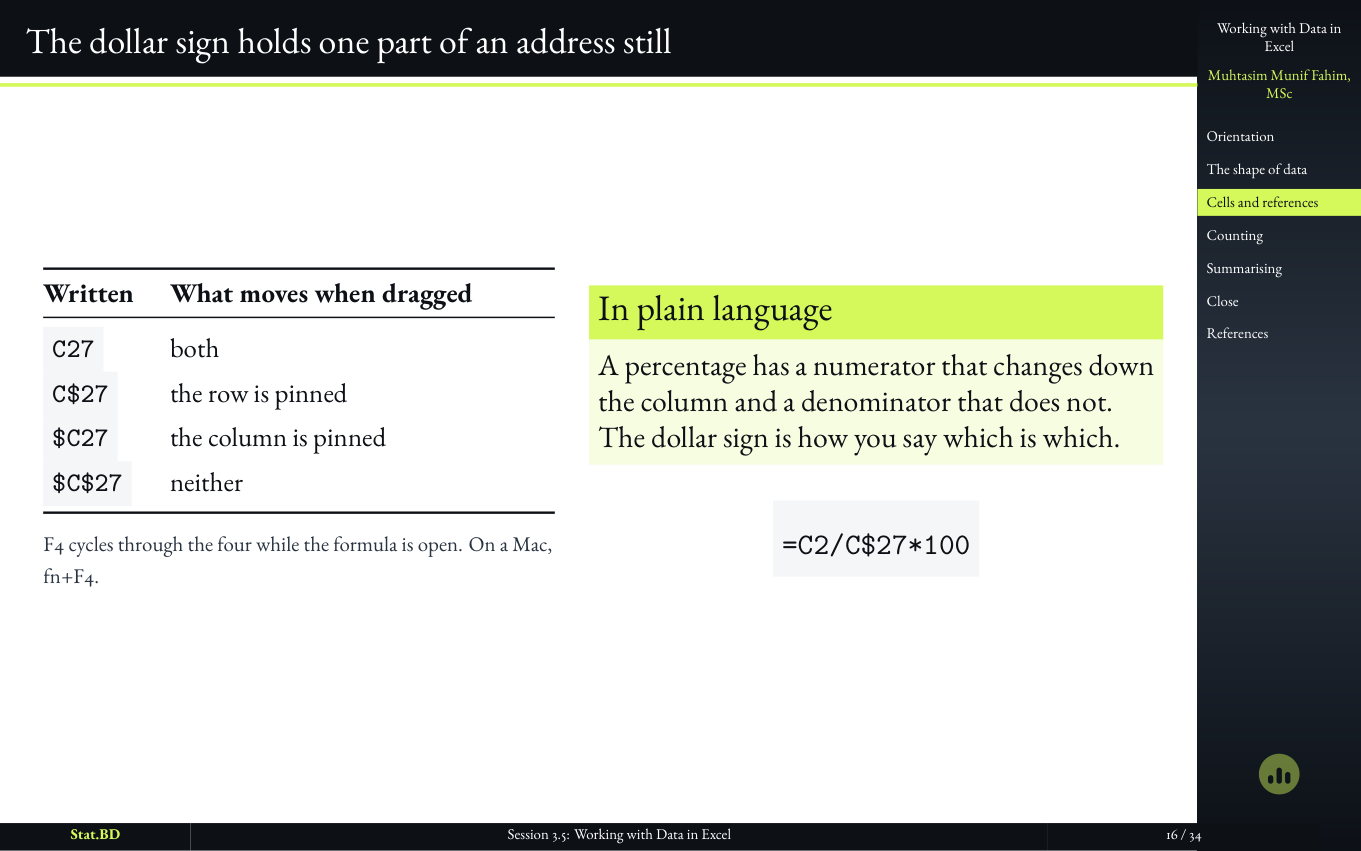
  6. Session 3.5, Act II · Addresses, formulas, and the denominator that moved: The dollar sign holds one part of an address still.

    স্লাইড ১৬

    The dollar sign holds one part of an address still

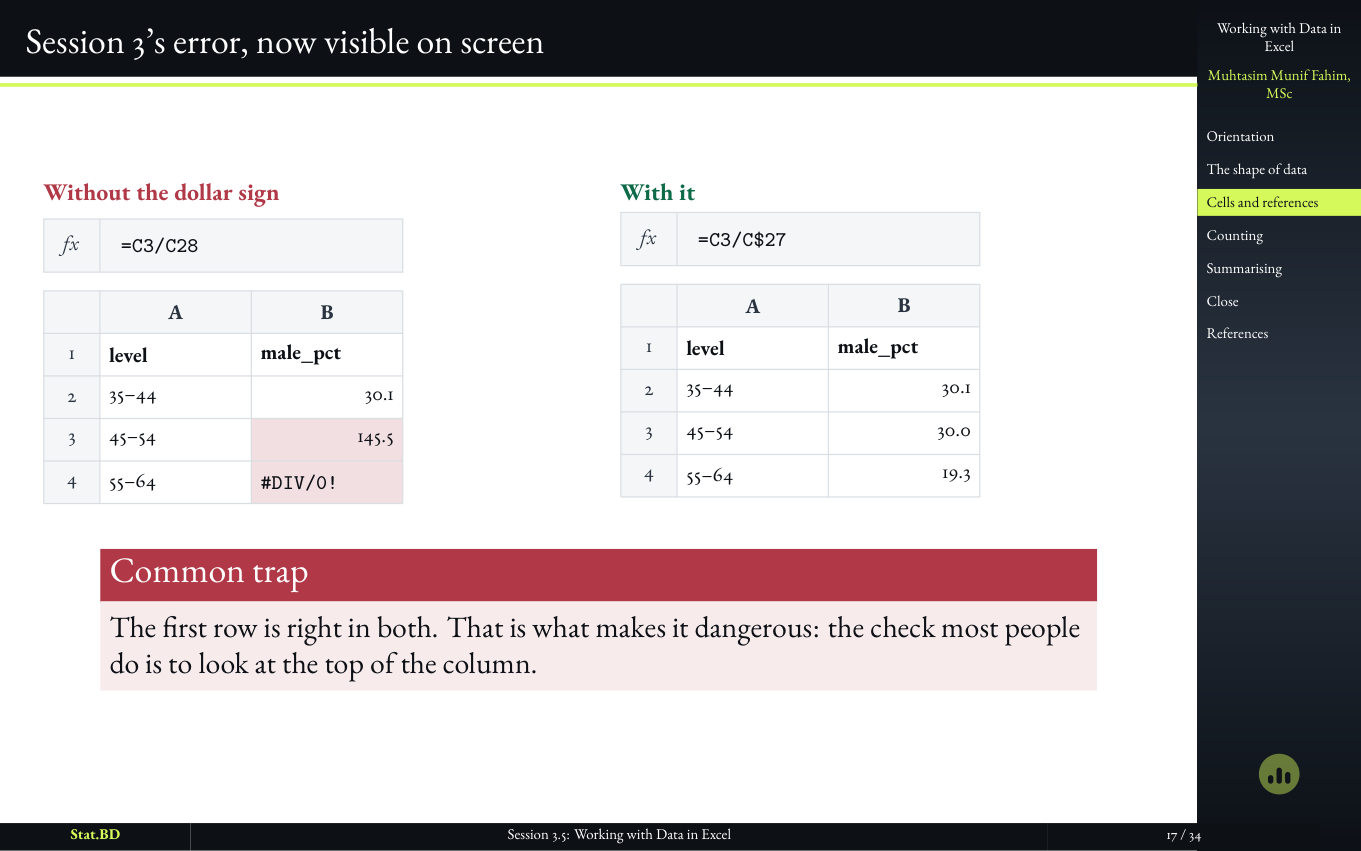
  7. Session 3.5, Act II · Addresses, formulas, and the denominator that moved: Session 3’s error, now visible on screen.

    স্লাইড ১৭

    Session 3’s error, now visible on screen

৮টি স্লাইড

Act III · Counting a Categorical Column
  1. Session 3.5, Act III · Counting a categorical column: Act III · Counting a categorical column.

    স্লাইড ১৮

    Act III · Counting a Categorical Column
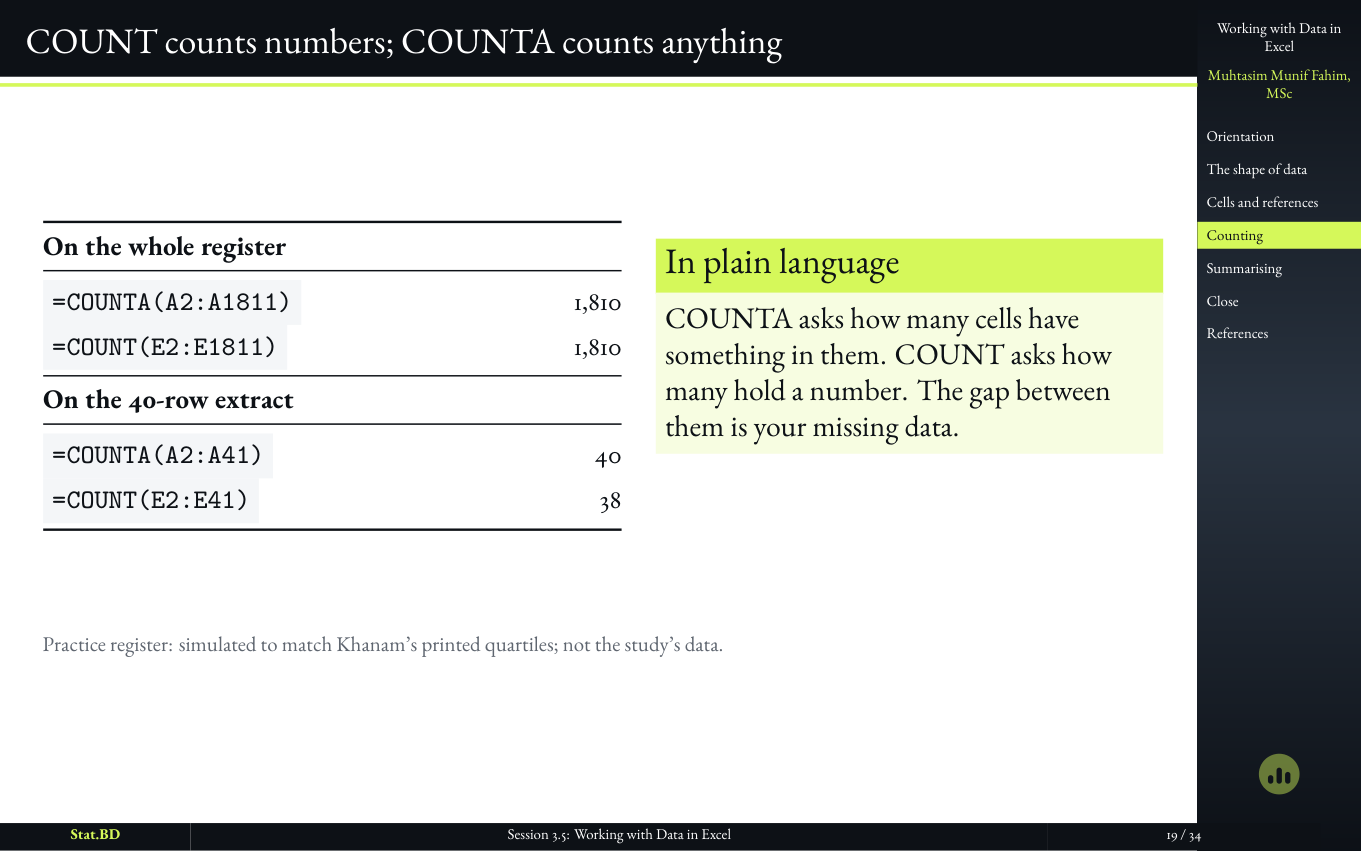
  2. Session 3.5, Act III · Counting a categorical column: COUNT counts numbers; COUNTA counts anything.

    স্লাইড ১৯

    COUNT counts numbers; COUNTA counts anything

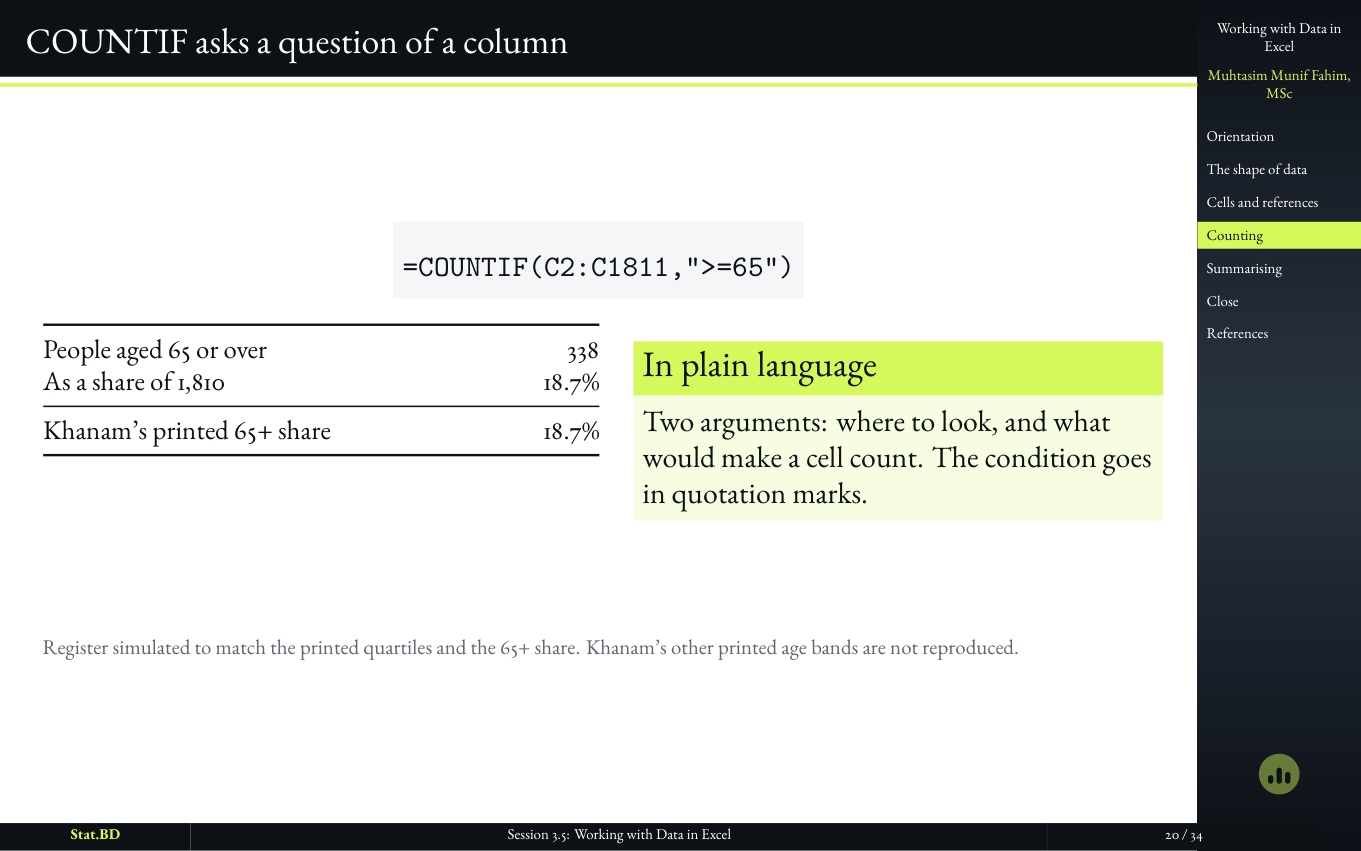
  3. Session 3.5, Act III · Counting a categorical column: COUNTIF asks a question of a column.

    স্লাইড ২০

    COUNTIF asks a question of a column

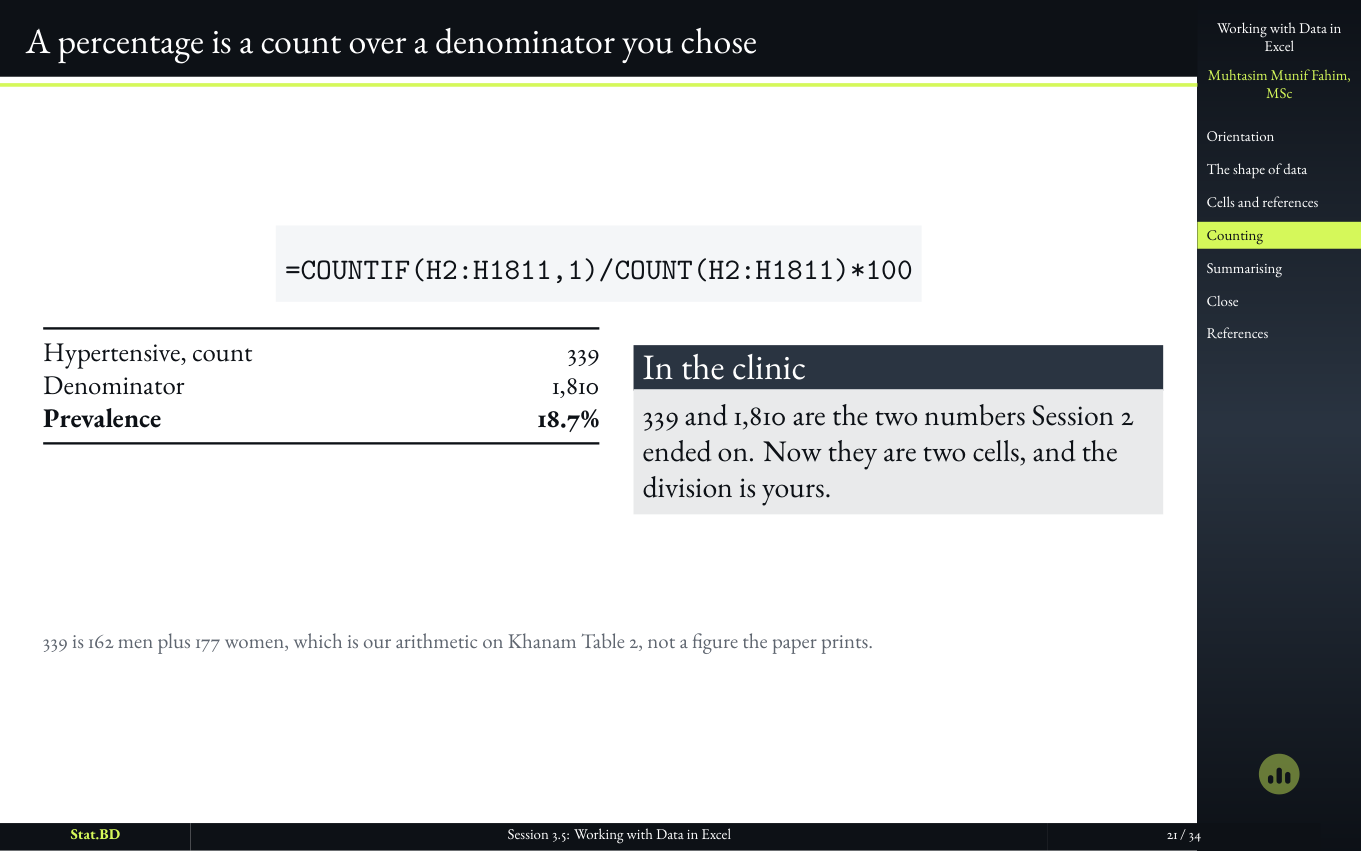
  4. Slide showing a percentage as a count over a denominator the analyst chose.

    স্লাইড ২১

    A percentage is a count over a denominator you chose

    Session 3’s sentence becomes a formula. The denominator is still a choice. Excel will not make it for you; it will only remember the choice you typed.

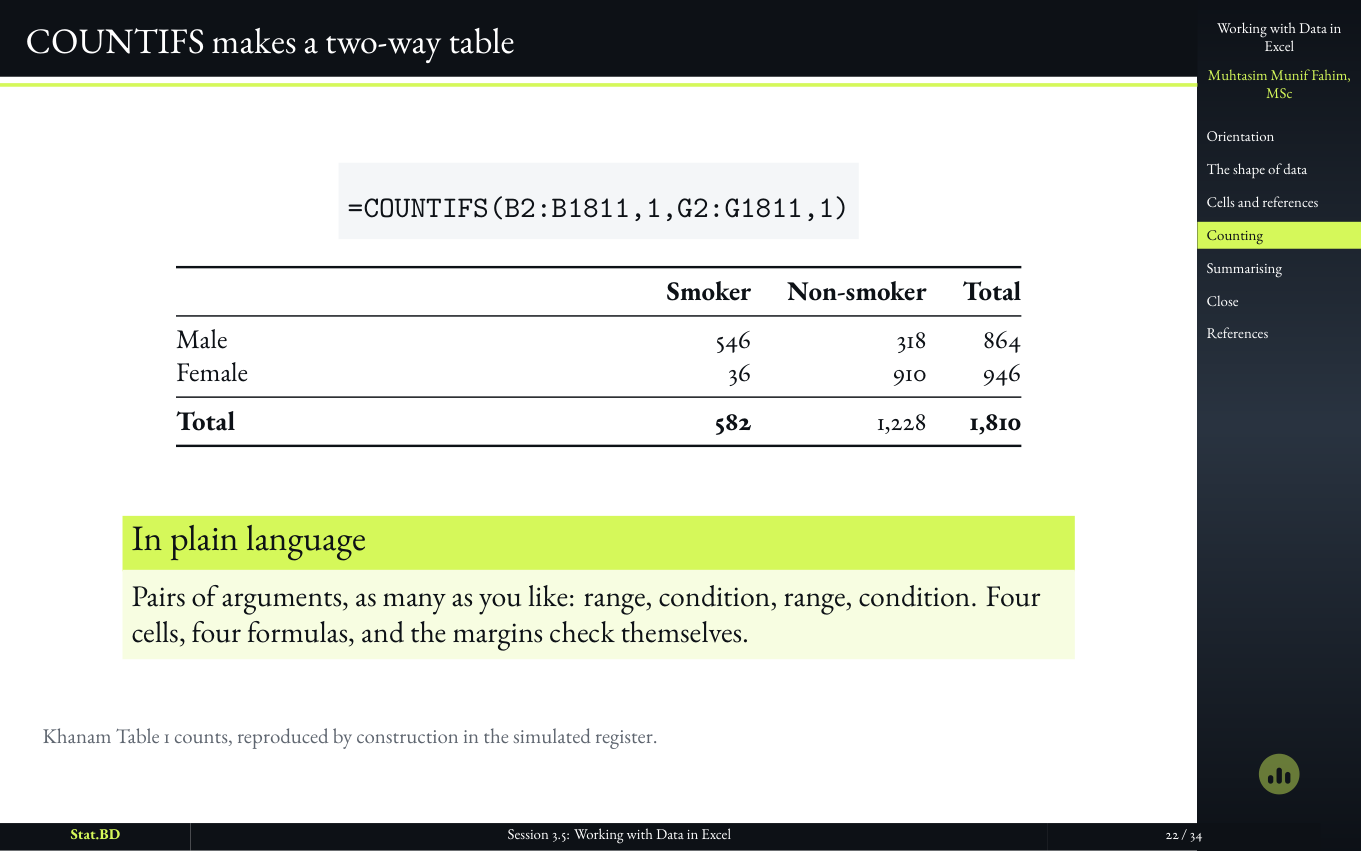
  5. Session 3.5, Act III · Counting a categorical column: COUNTIFS makes a two-way table.

    স্লাইড ২২

    COUNTIFS makes a two-way table

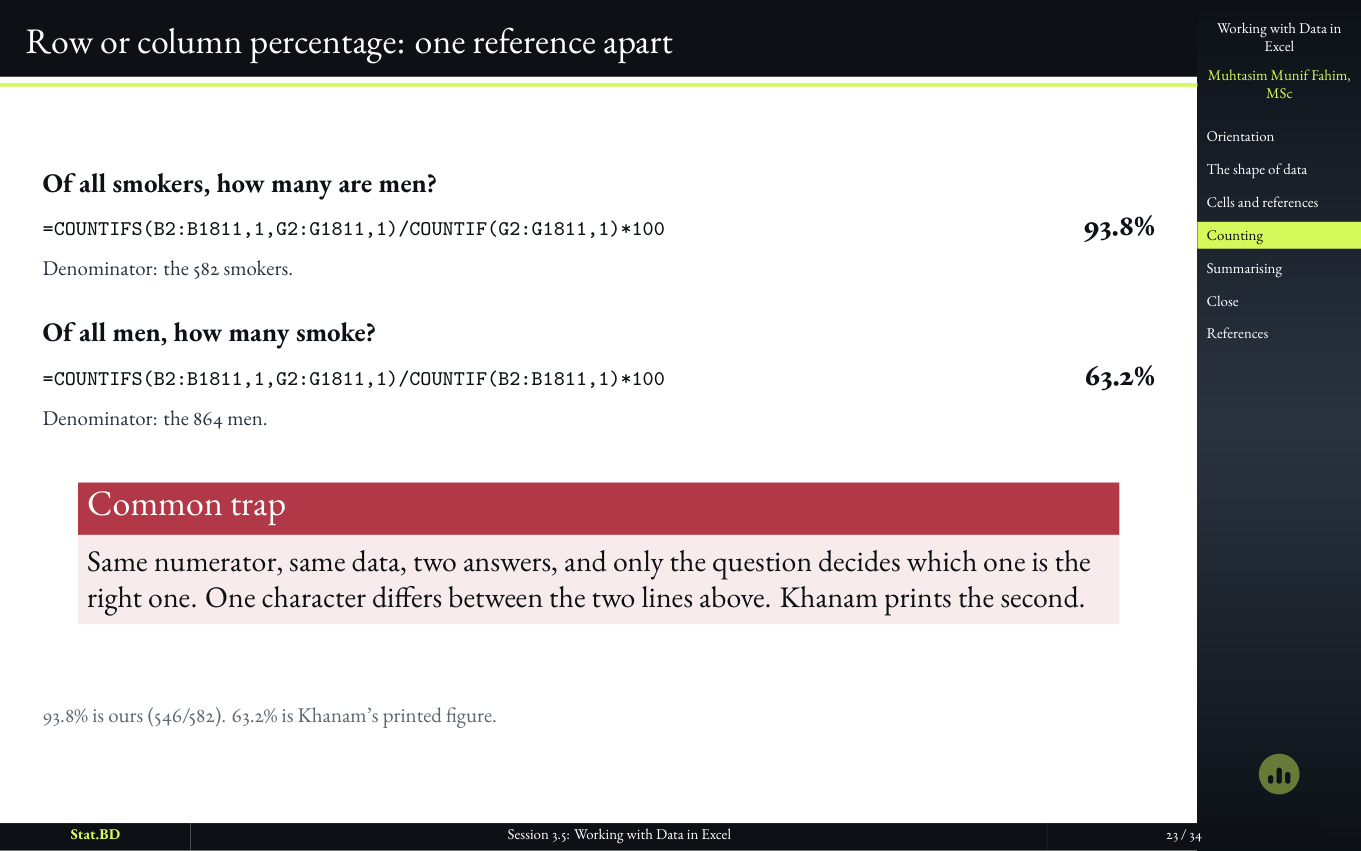
  6. Session 3.5, Act III · Counting a categorical column: Row or column percentage: one reference apart.

    স্লাইড ২৩

    Row or column percentage: one reference apart

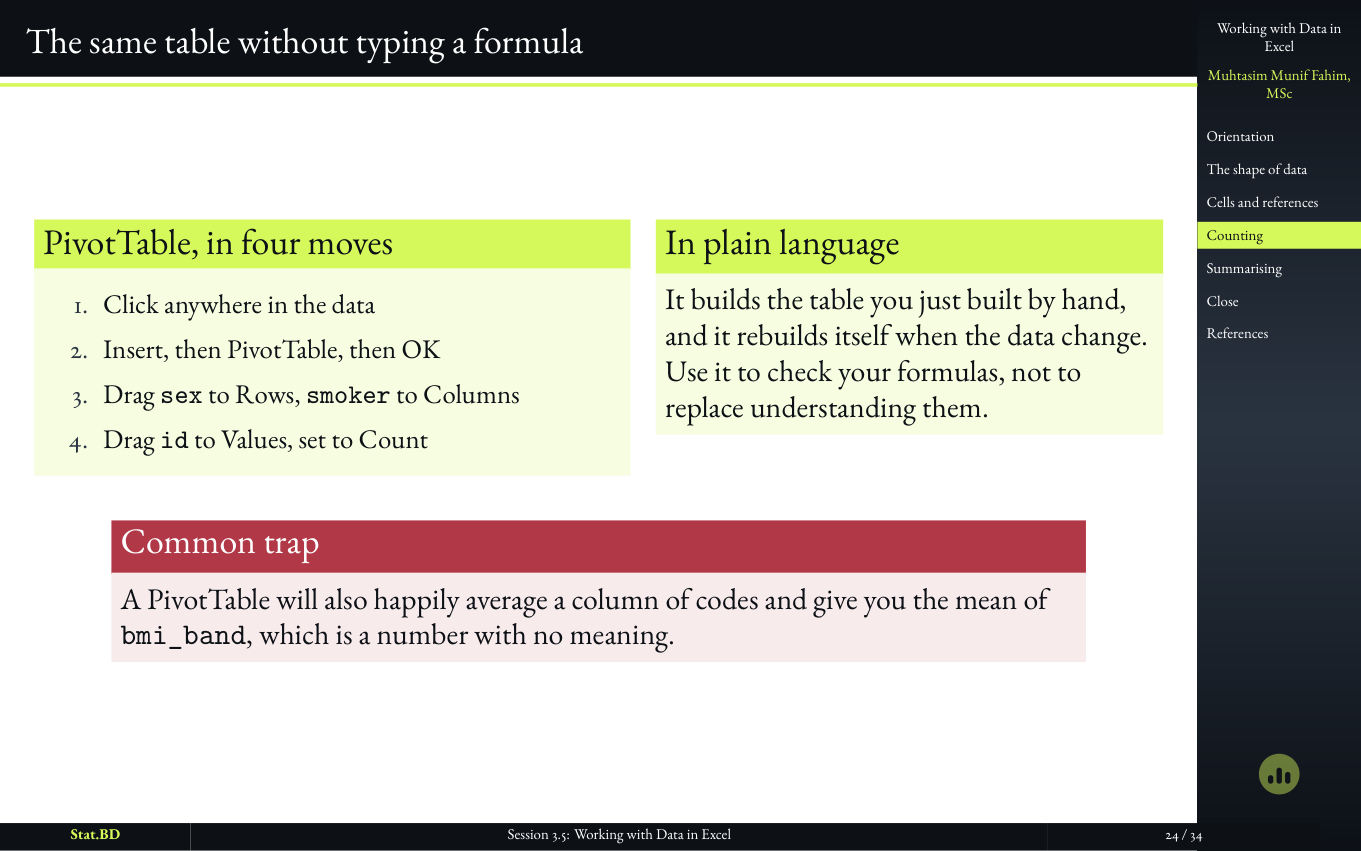
  7. Session 3.5, Act III · Counting a categorical column: The same table without typing a formula.

    স্লাইড ২৪

    The same table without typing a formula

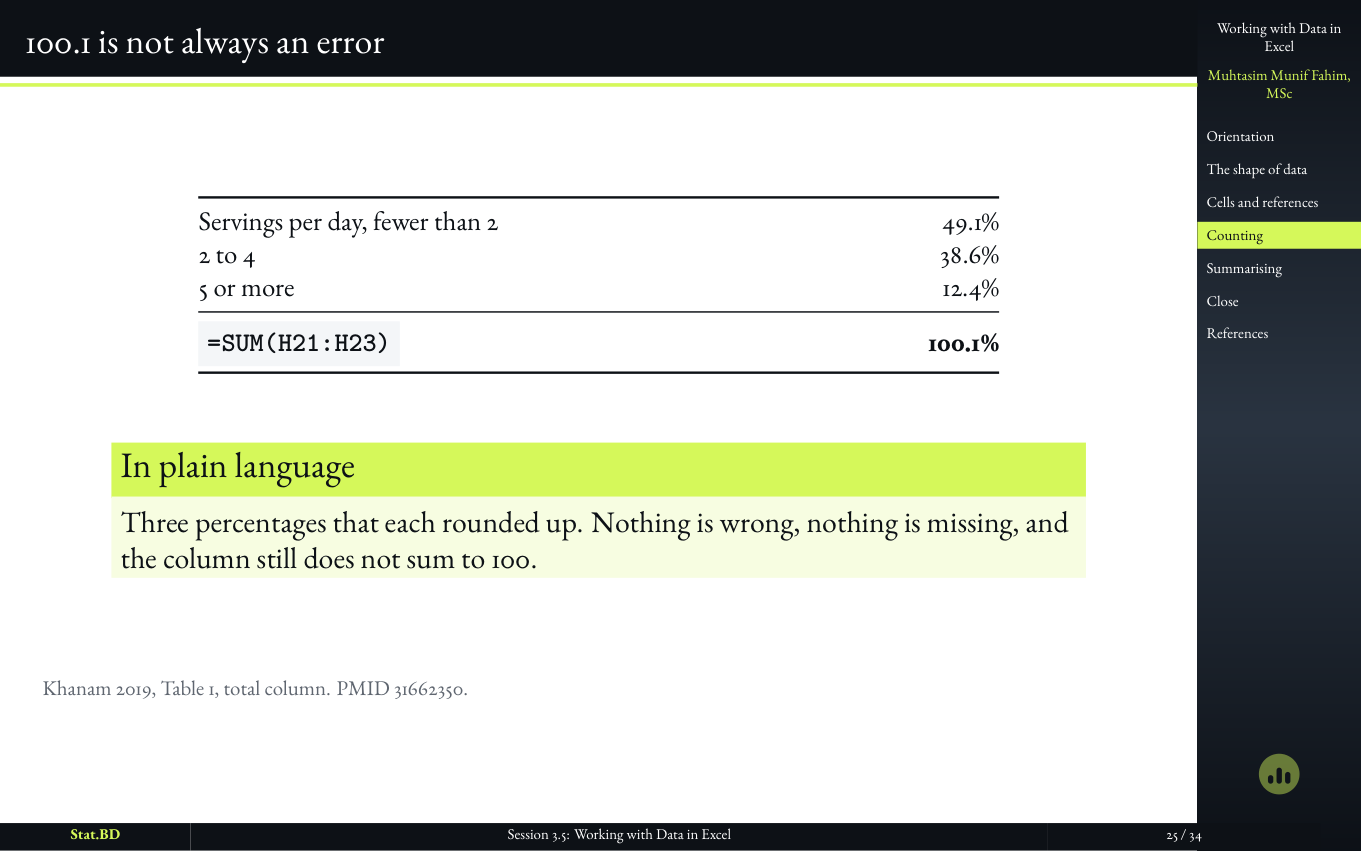
  8. Session 3.5, Act III · Counting a categorical column: 100.1 is not always an error.

    স্লাইড ২৫

    100.1 is not always an error

৯টি স্লাইড

Act IV · Summarizing a Numerical Column

  1. Session 3.5, Act IV · Summarizing a numerical column: Act IV · Summarizing a numerical column.

    স্লাইড ২৬

    Act IV · Summarizing a Numerical Column
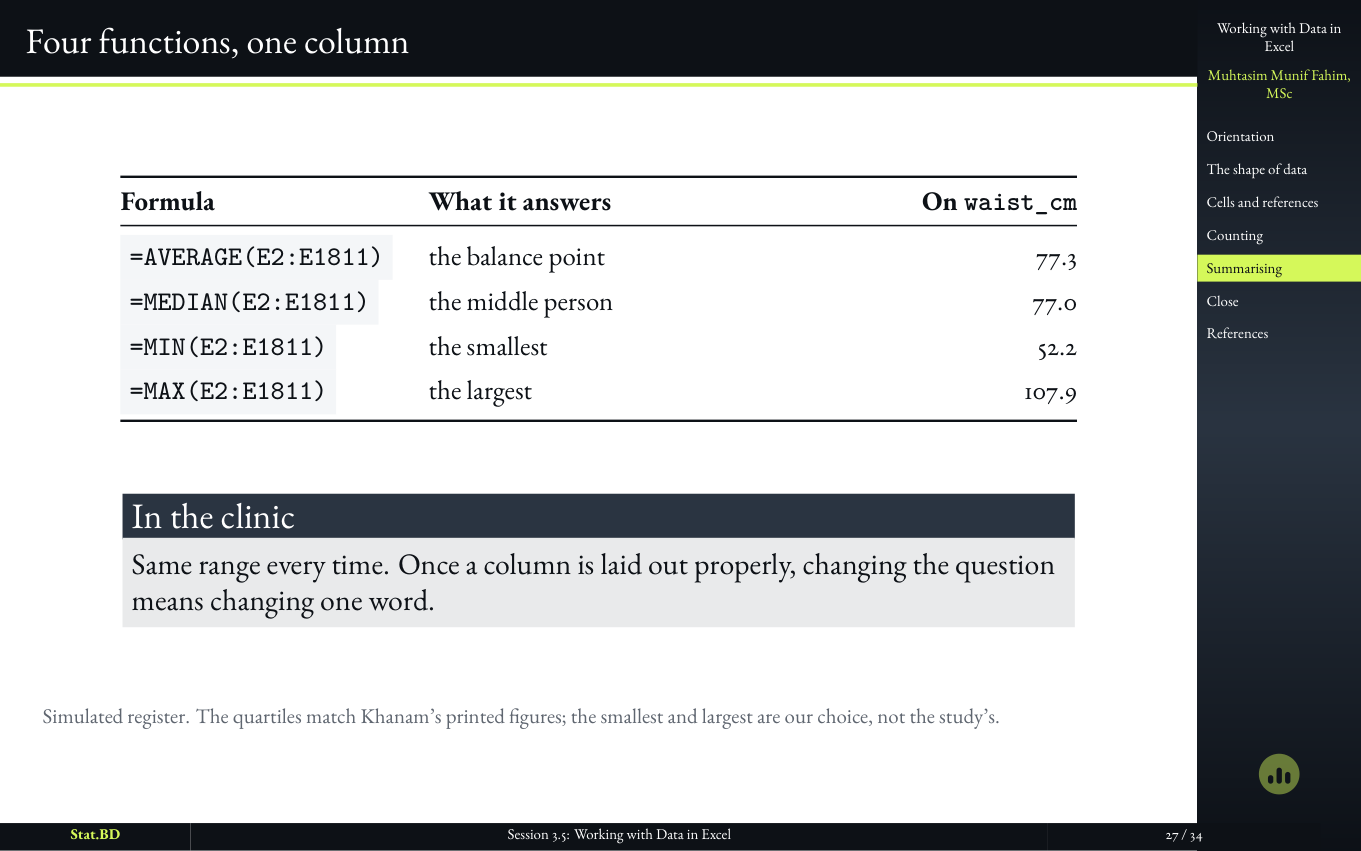
  2. Session 3.5, Act IV · Summarizing a numerical column: Four functions, one column.

    স্লাইড ২৭

    Four functions, one column

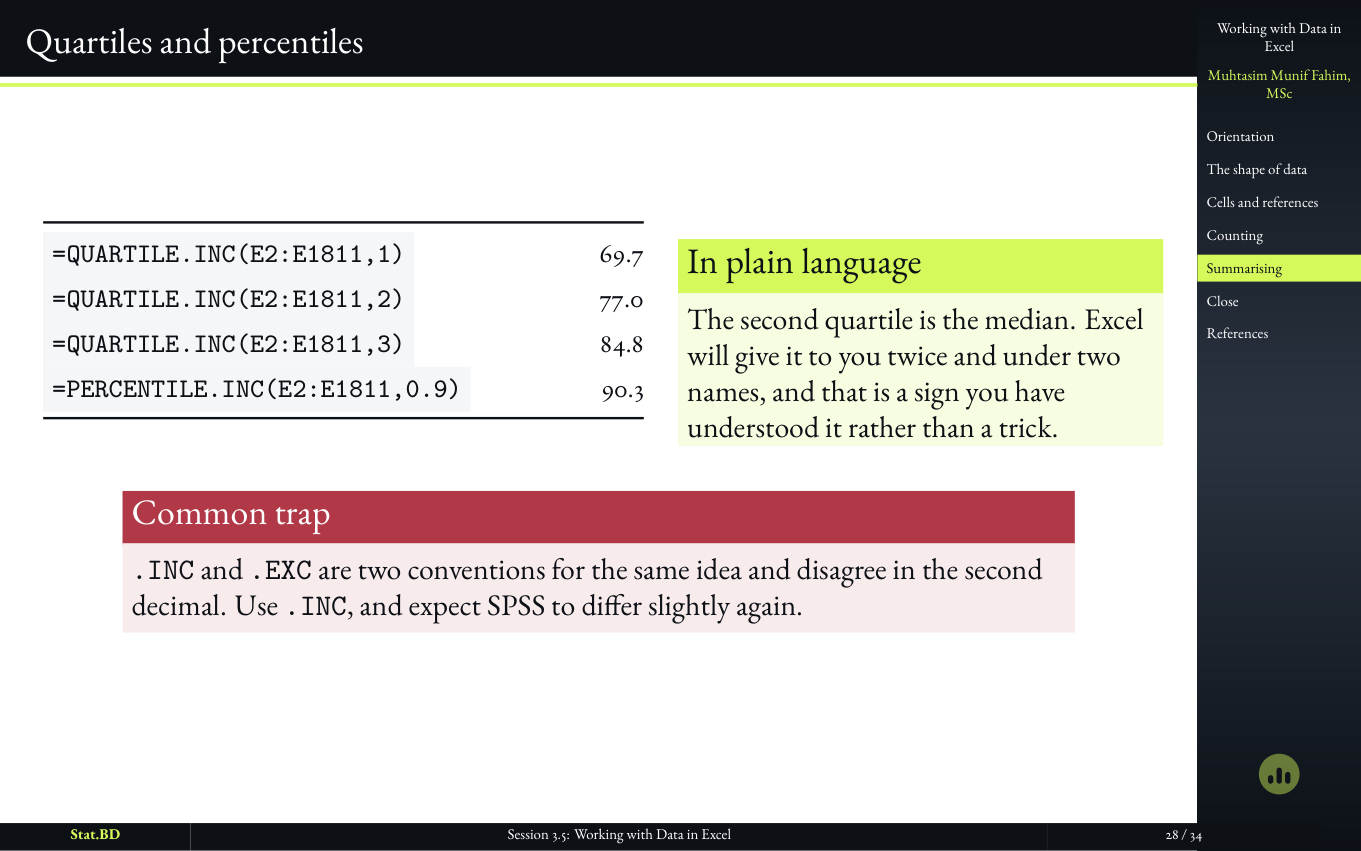
  3. Session 3.5, Act IV · Summarizing a numerical column: Quartiles and percentiles.

    স্লাইড ২৮

    Quartiles and percentiles

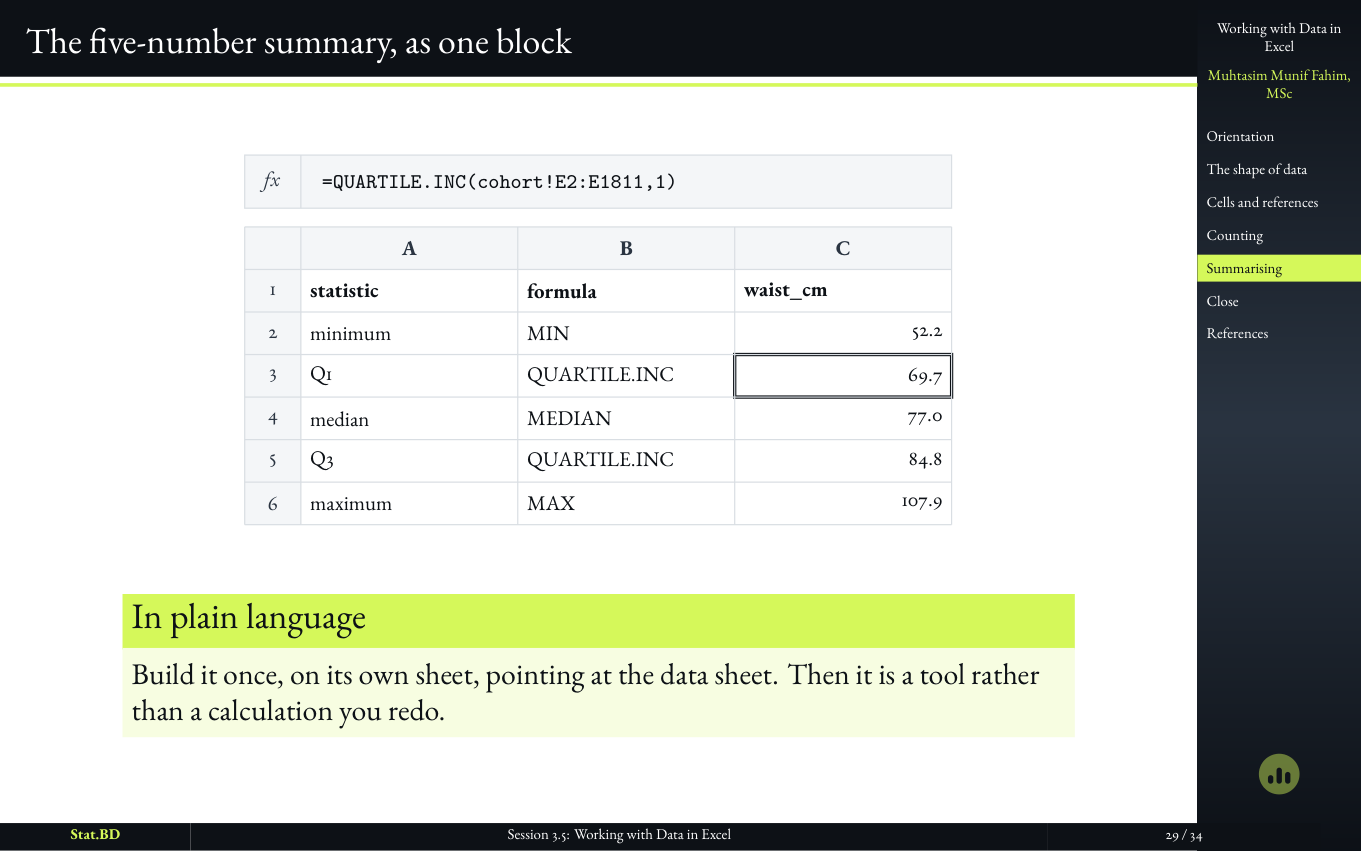
  4. Session 3.5, Act IV · Summarizing a numerical column: The five-number summary, as one block.

    স্লাইড ২৯

    The five-number summary, as one block

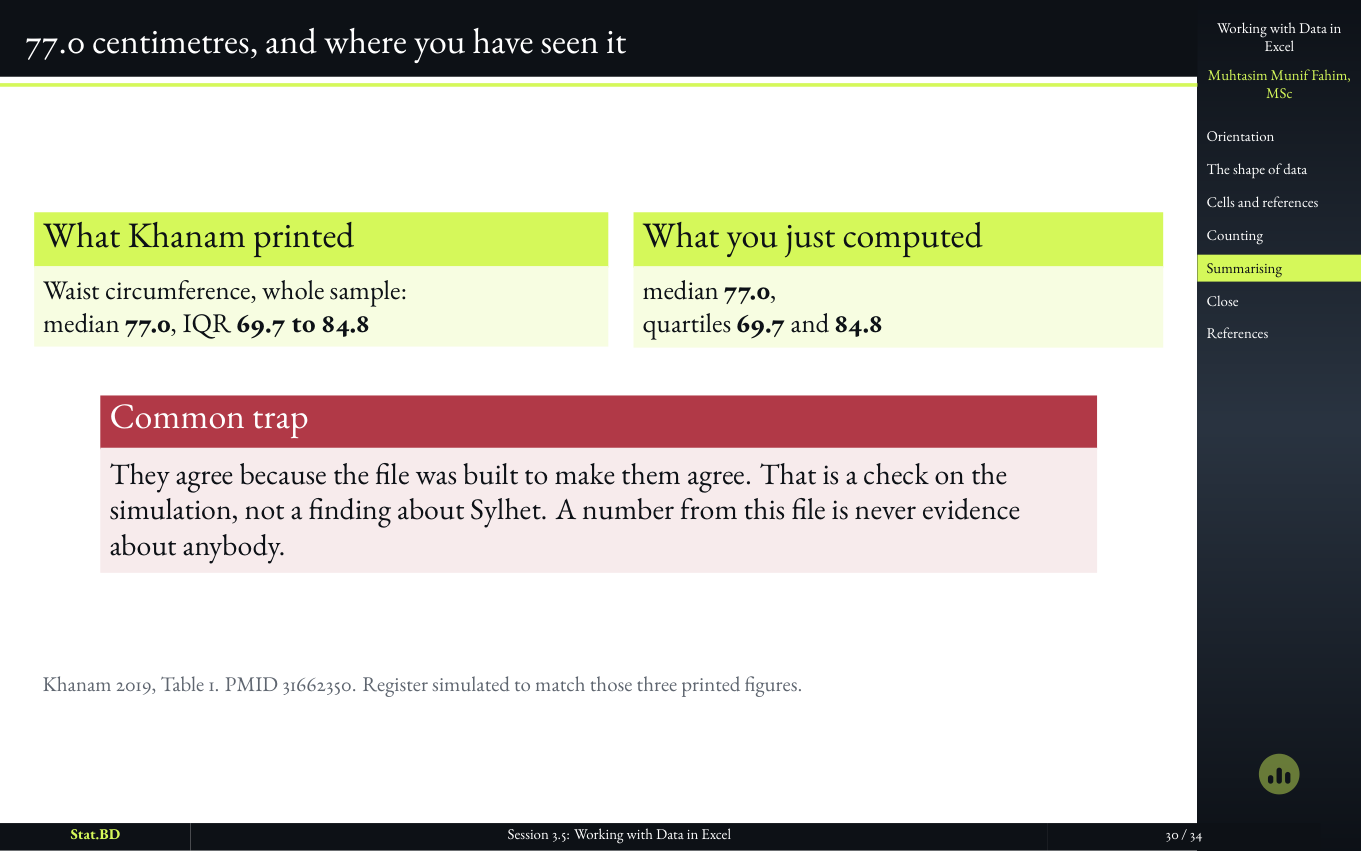
  5. Session 3.5, Act IV · Summarizing a numerical column: 77.0 centimetres, and where you have seen it.

    স্লাইড ৩০

    77.0 centimetres, and where you have seen it

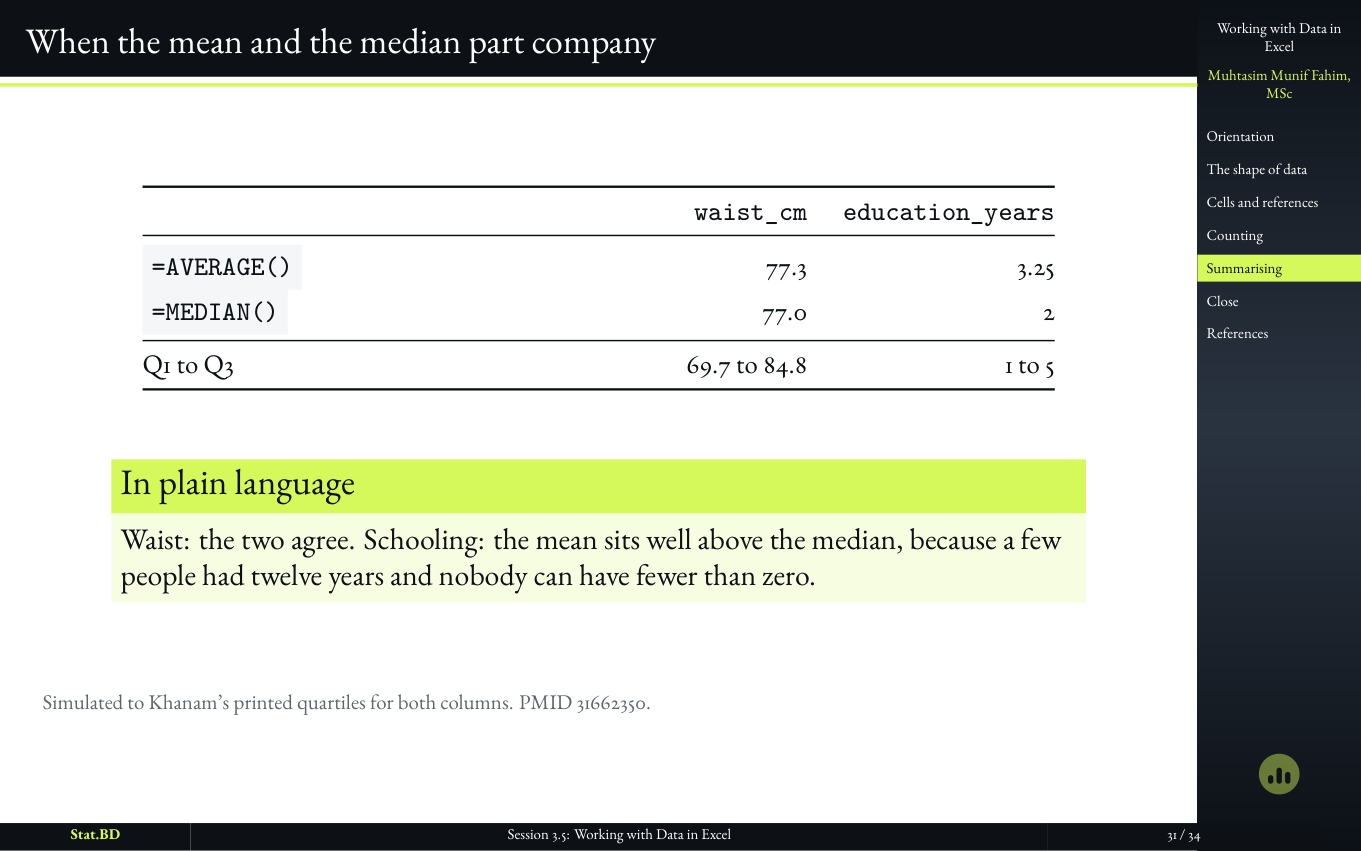
  6. Session 3.5, Act IV · Summarizing a numerical column: When the mean and the median part company.

    স্লাইড ৩১

    When the mean and the median part company

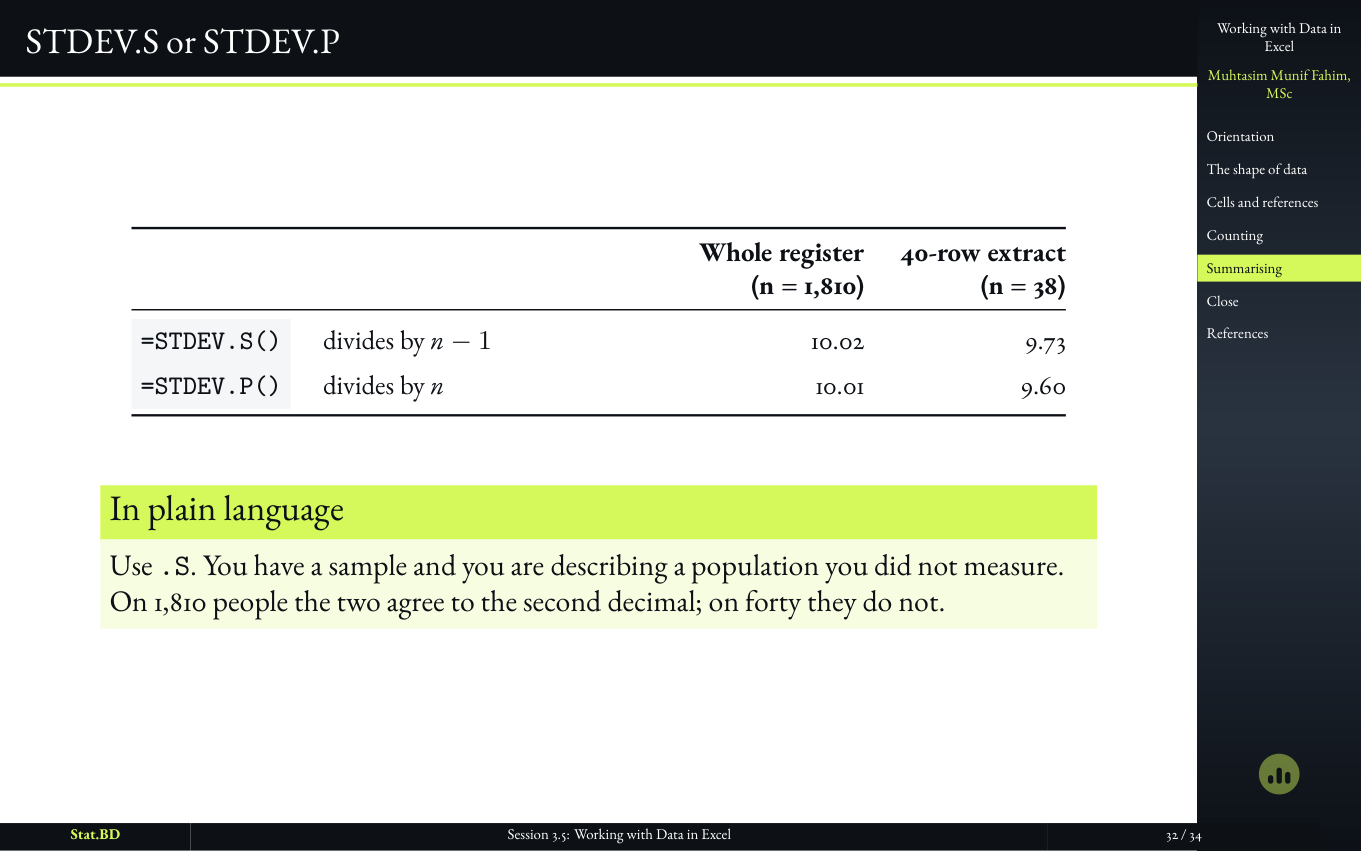
  7. Session 3.5, Act IV · Summarizing a numerical column: STDEV.S or STDEV.P.

    স্লাইড ৩২

    STDEV.S or STDEV.P

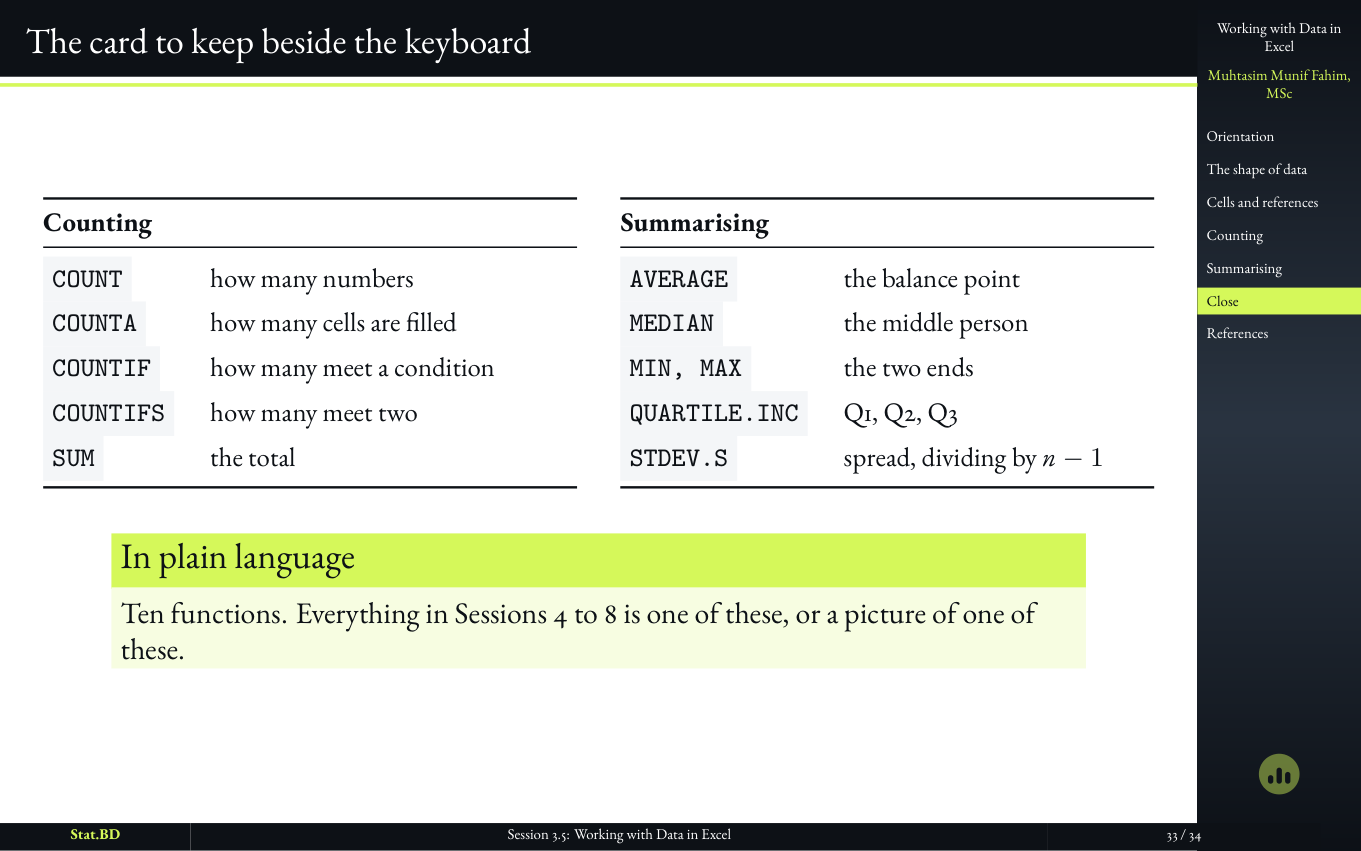
  8. Slide collecting the Excel functions the session needs on one card.

    স্লাইড ৩৩

    The card to keep beside the keyboard

    A short list, not a software syllabus. COUNT, COUNTIF, the five-number summary, and the one rule about missing values. Session 4 then asks which of those numbers a paper should print.

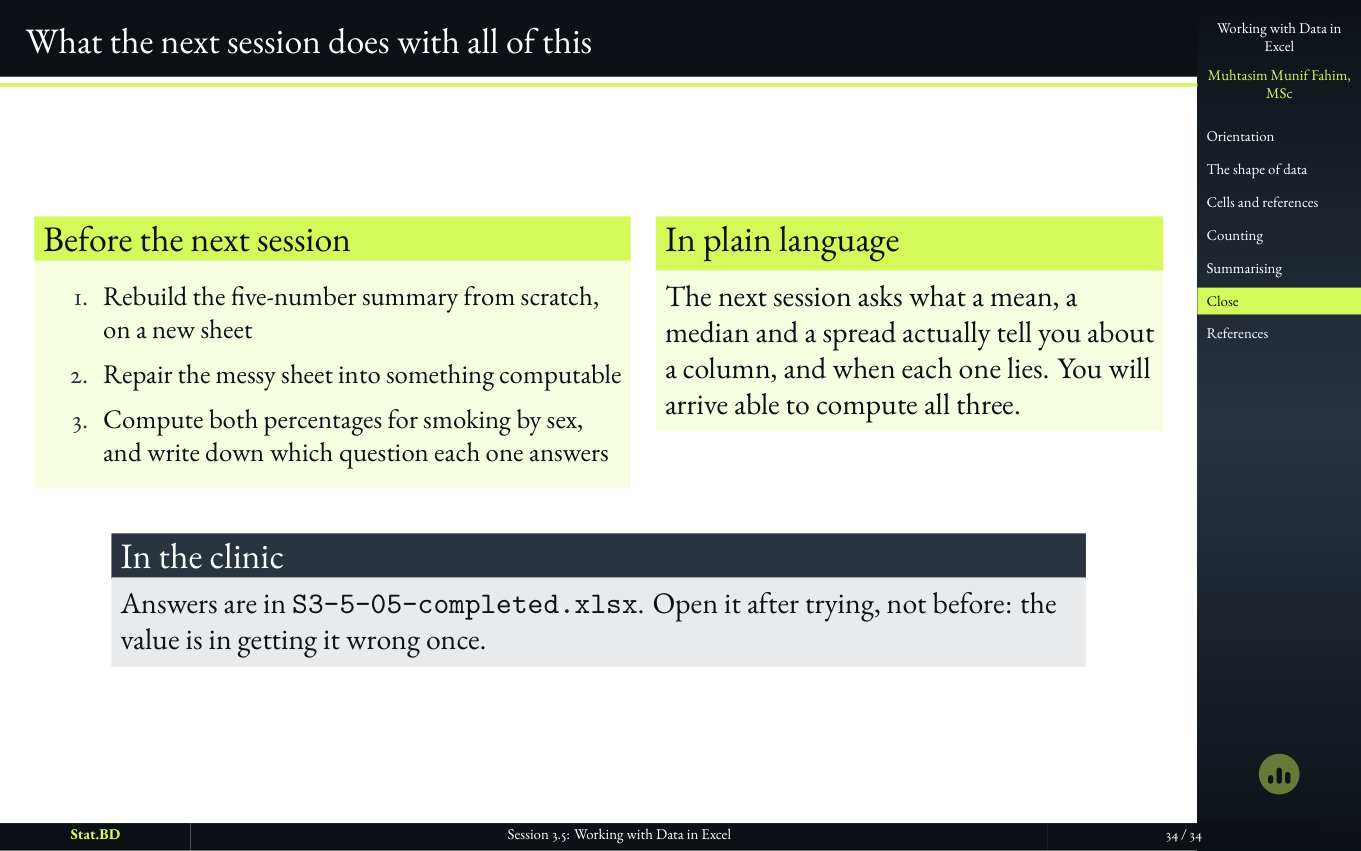
  9. Session 3.5, Act IV · Summarizing a numerical column: What the next session does with all of this.

    স্লাইড ৩৪

    What the next session does with all of this

নাম বলে রেখে দেওয়া

যা ইচ্ছে করেই এখনো পড়াইনি

  • পেপারে কোন সামারি ছাপা উচিত (সেশন ৪)।
  • Distribution ও Outlier (সেশন ৫)।
  • SPSS ল্যাব আসে ধারণা বোঝার পরে। সেগুলো এই শিটের বিকল্প নয়।

পরের সেশন

সেশন ৪: Numerical Data-র বর্ণনা

পরের ক্লাসটাও সাইটে আছে। চাইলে নিজের প্রশ্ন ঘিরে একটা প্ল্যানও চেয়ে নিতে পারেন।