3 slides

Orientation

  1. Session 3 title slide: Describing Categorical Data.

    Slide 1

    Describing Categorical Data

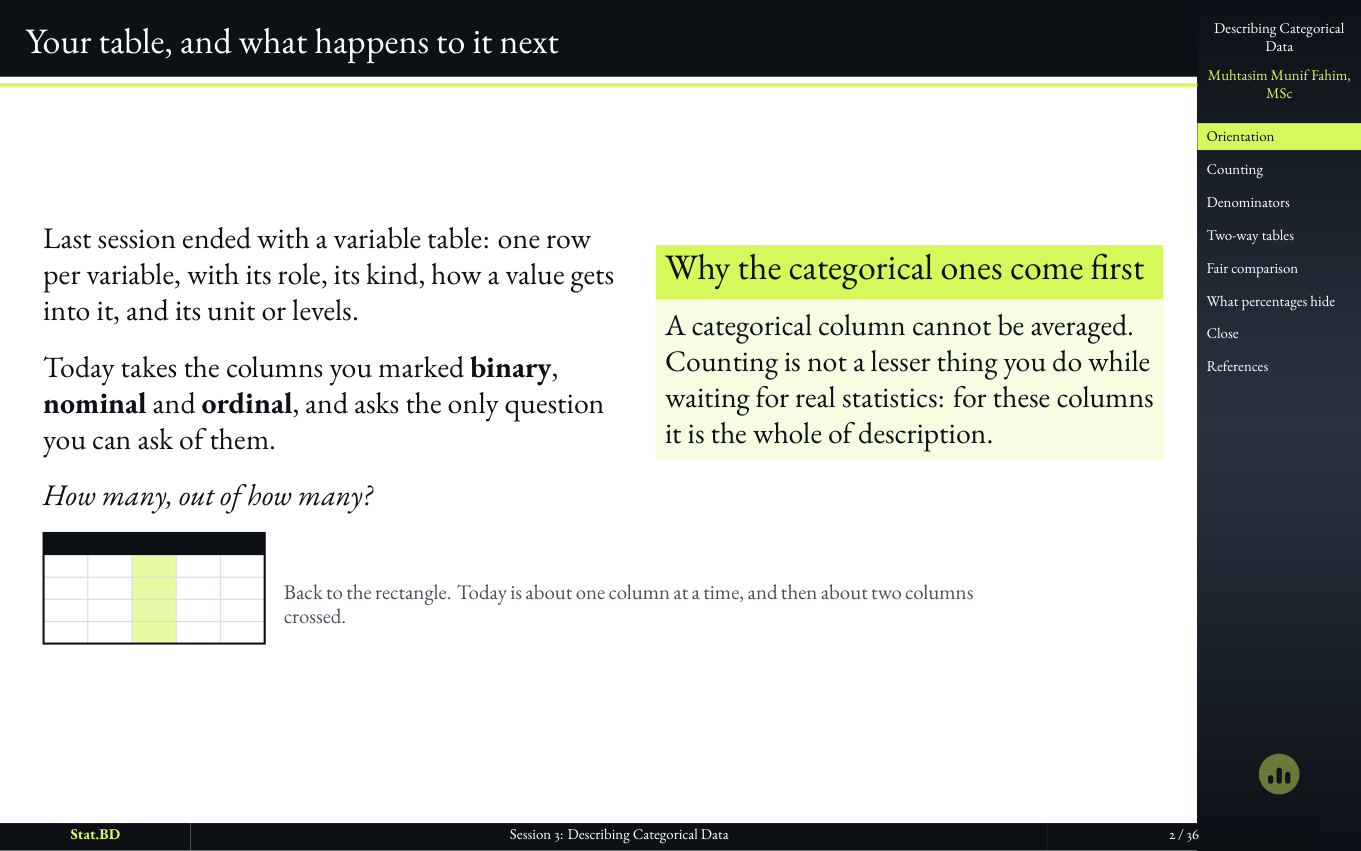
  2. Slide opening on the variable table from Session 2 and the question asked of categorical columns.

    Slide 2

    How many, out of how many?

    A categorical column cannot be averaged. The session starts from that fact rather than from a list of percentages to memorise.

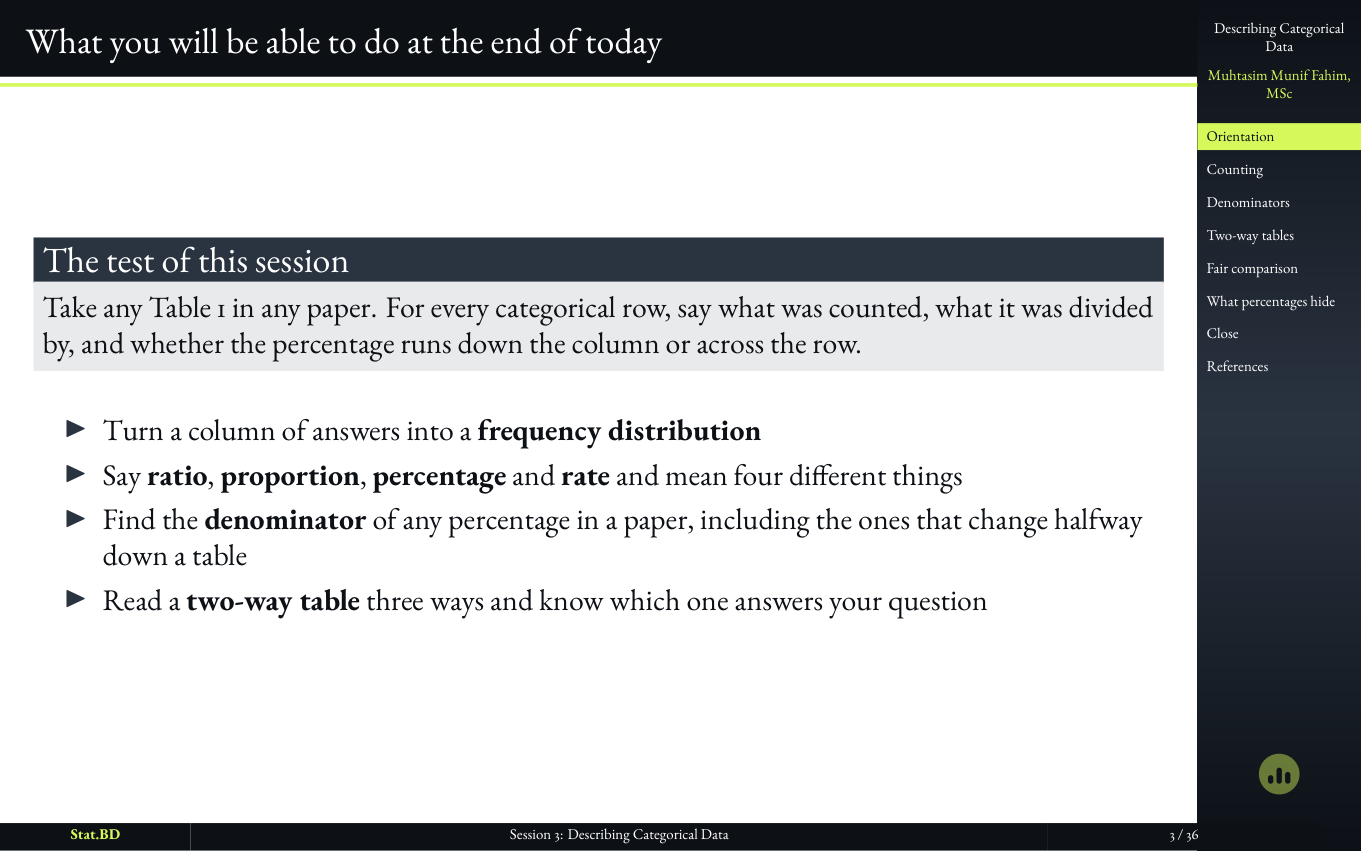
  3. Session 3, Orientation: What you will be able to do at the end of today.

    Slide 3

    What you will be able to do at the end of today

6 slides

Act I · Counting, and the Three Things It Turns Into

  1. Session 3, Act I · Counting, and the three things it turns into: Act I · Counting, and the three things it turns into.

    Slide 4

    Act I · Counting, and the Three Things It Turns Into
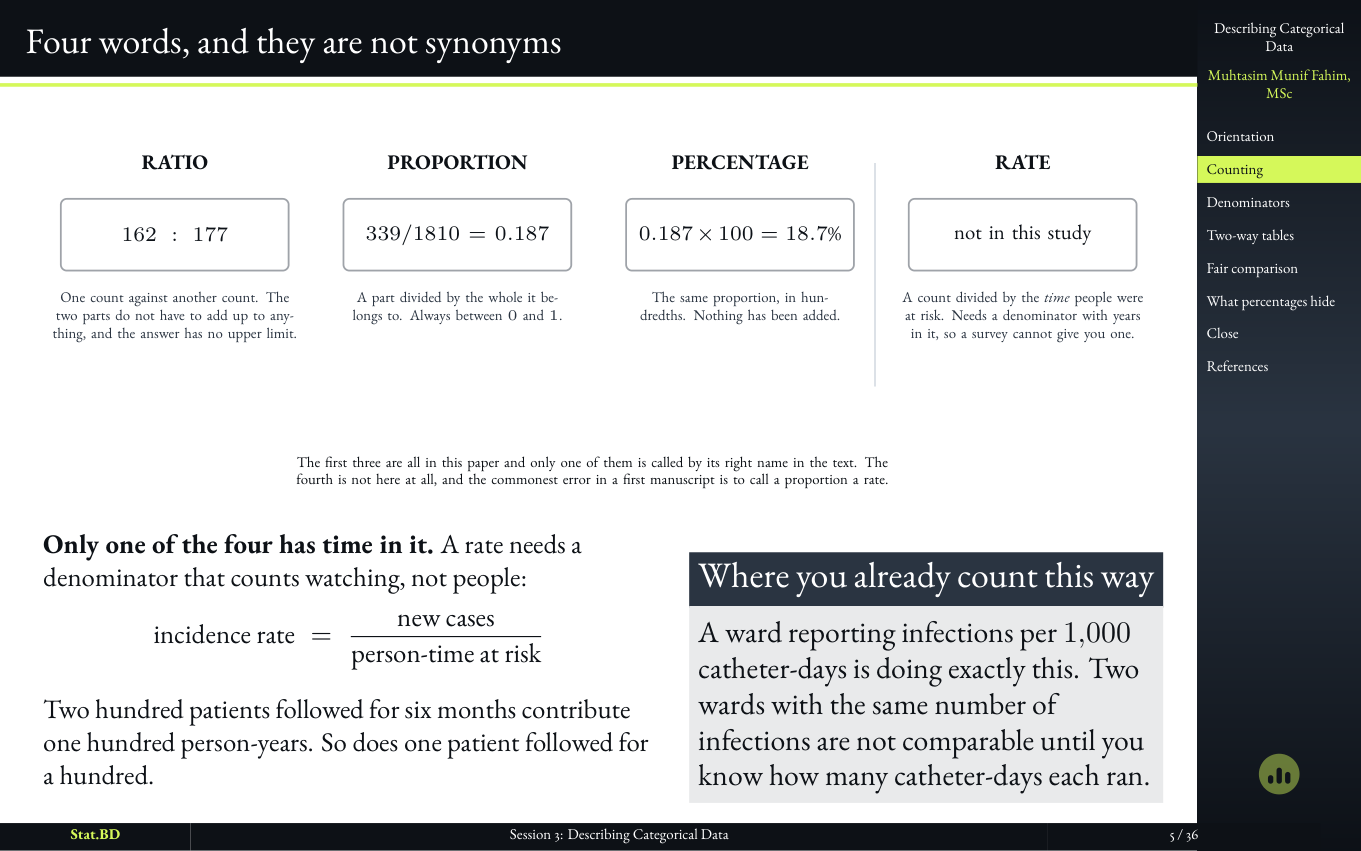
  2. Slide distinguishing count, proportion, percentage, and rate.

    Slide 5

    Four words, and they are not synonyms

    Count, proportion, percentage, and rate get used as if they were the same sentence. They are not. The rest of the afternoon is about keeping the denominator in the sentence so the word you print still means something.

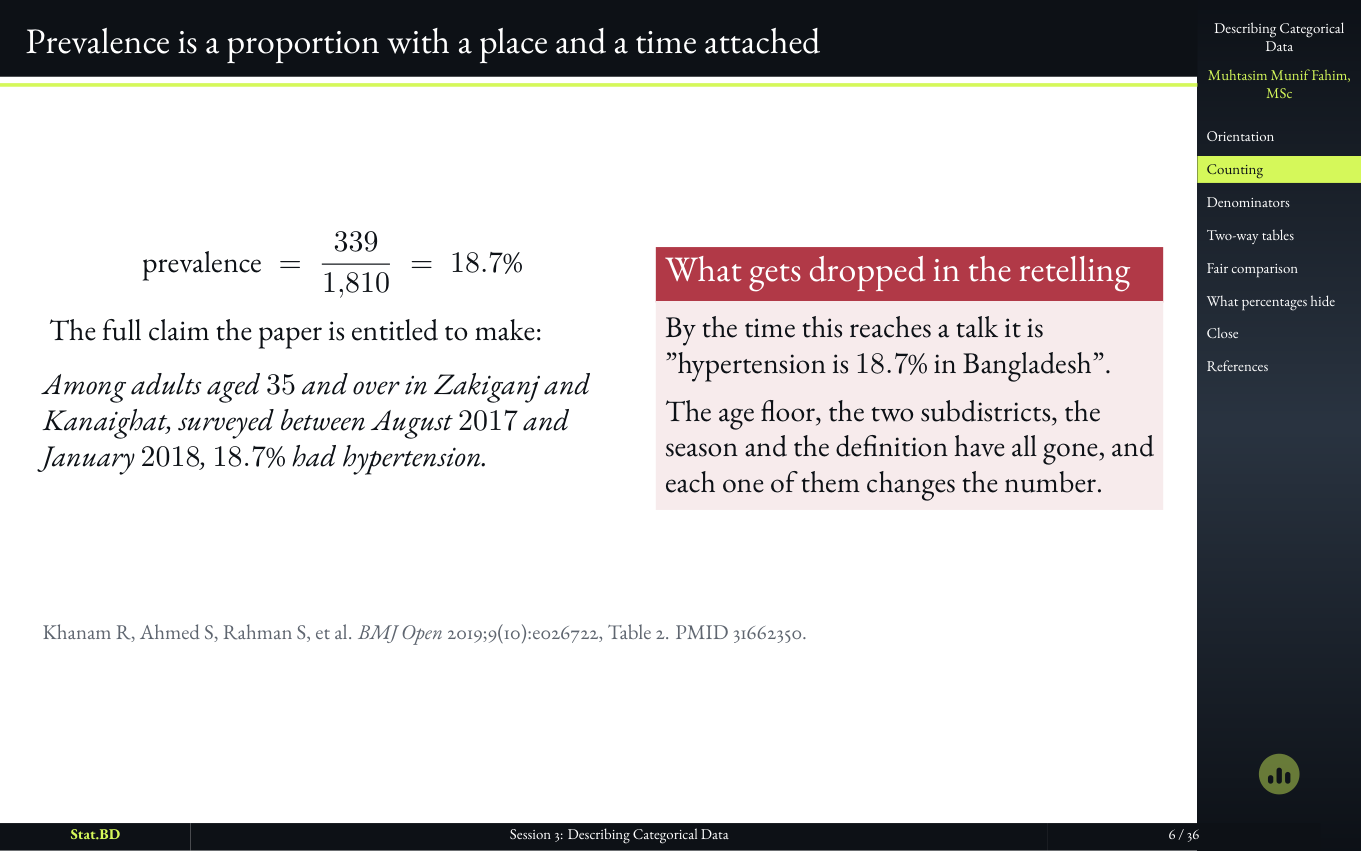
  3. Slide defining prevalence as a proportion with a place and a time attached.

    Slide 6

    Prevalence needs a place and a time

    A prevalence is a proportion with an address. ‘Hypertension is 18.7%’ is not yet a finding. ‘Among these adults, in this district, in these years’ is.

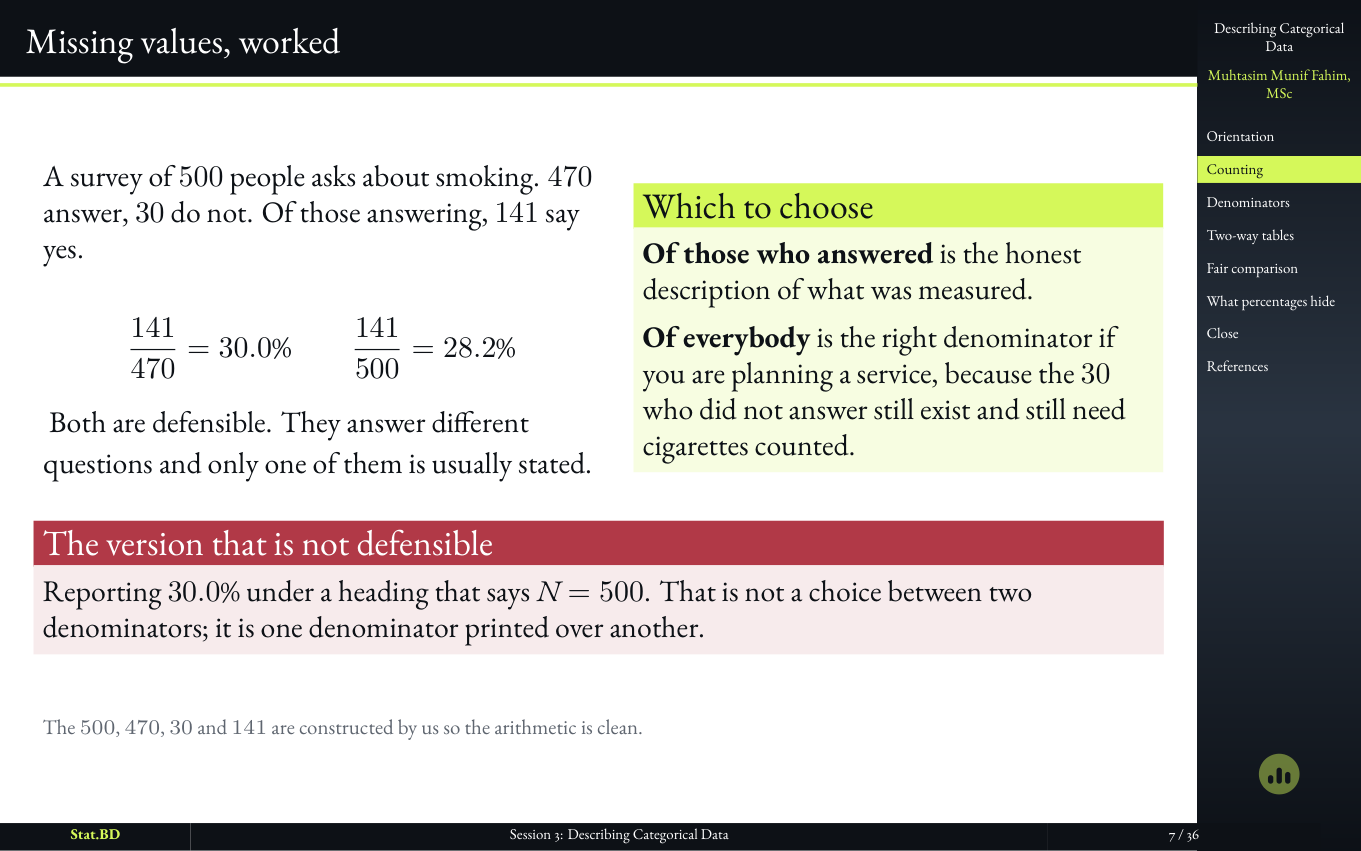
  4. Session 3, Act I · Counting, and the three things it turns into: Missing values, worked.

    Slide 7

    Missing values, worked

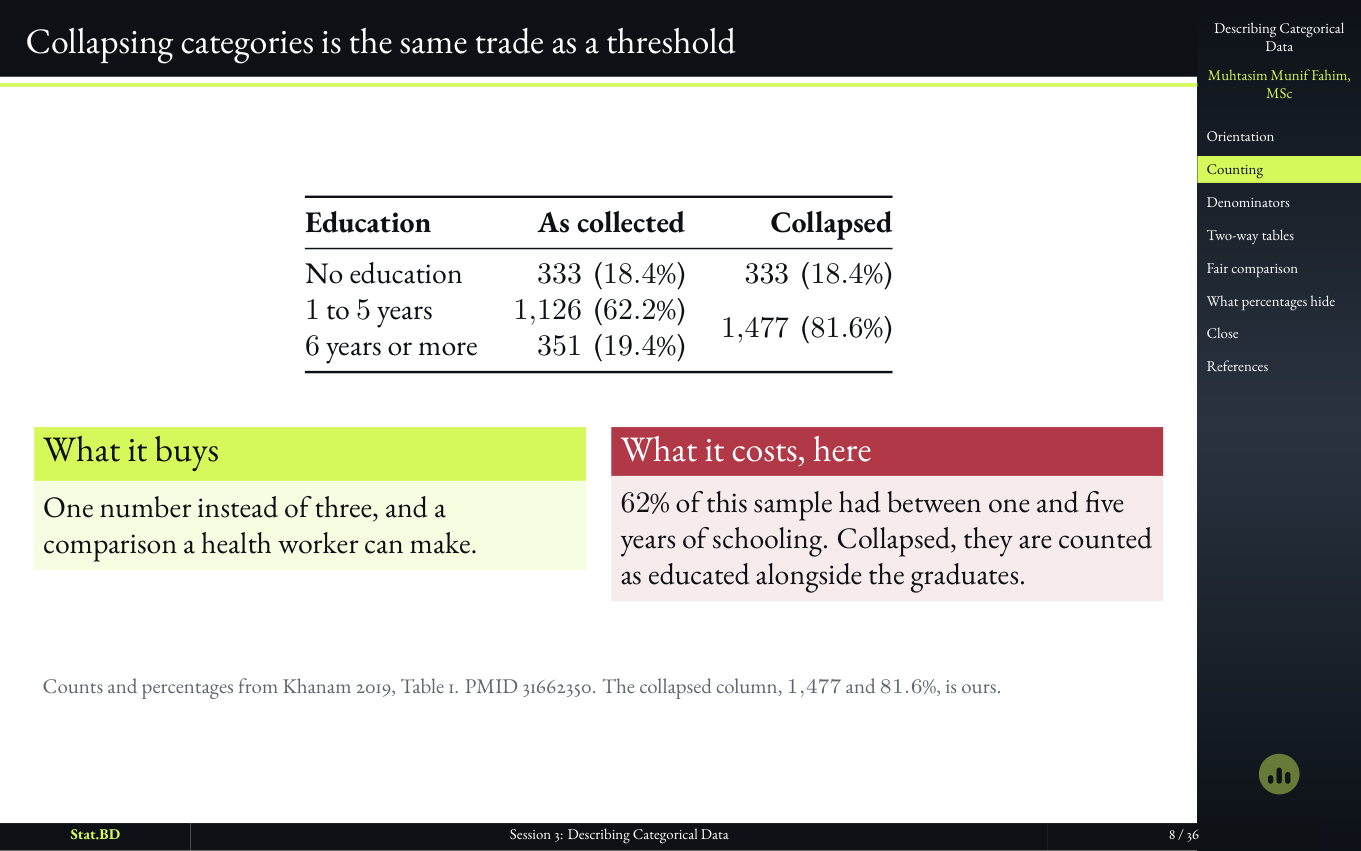
  5. Session 3, Act I · Counting, and the three things it turns into: Collapsing categories is the same trade as a threshold.

    Slide 8

    Collapsing categories is the same trade as a threshold

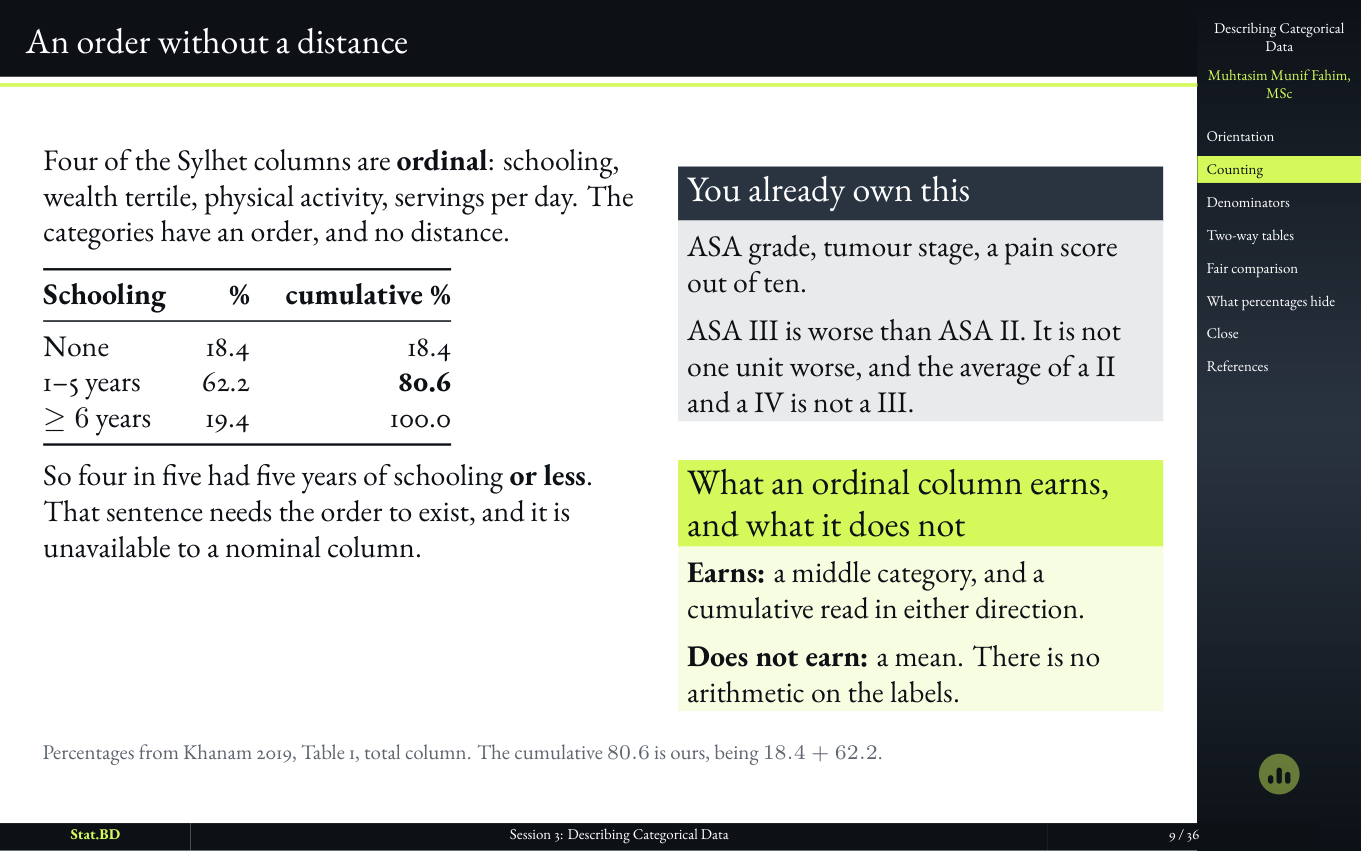
  6. Session 3, Act I · Counting, and the three things it turns into: An order without a distance.

    Slide 9

    An order without a distance

7 slides

Act II · Out of How Many? The Question the Number Does Not Answer
  1. Session 3, Act II · Out of how many? The question the number does not answer: Act II · Out of how many? The question the number does not answer.

    Slide 10

    Act II · Out of How Many? The Question the Number Does Not Answer
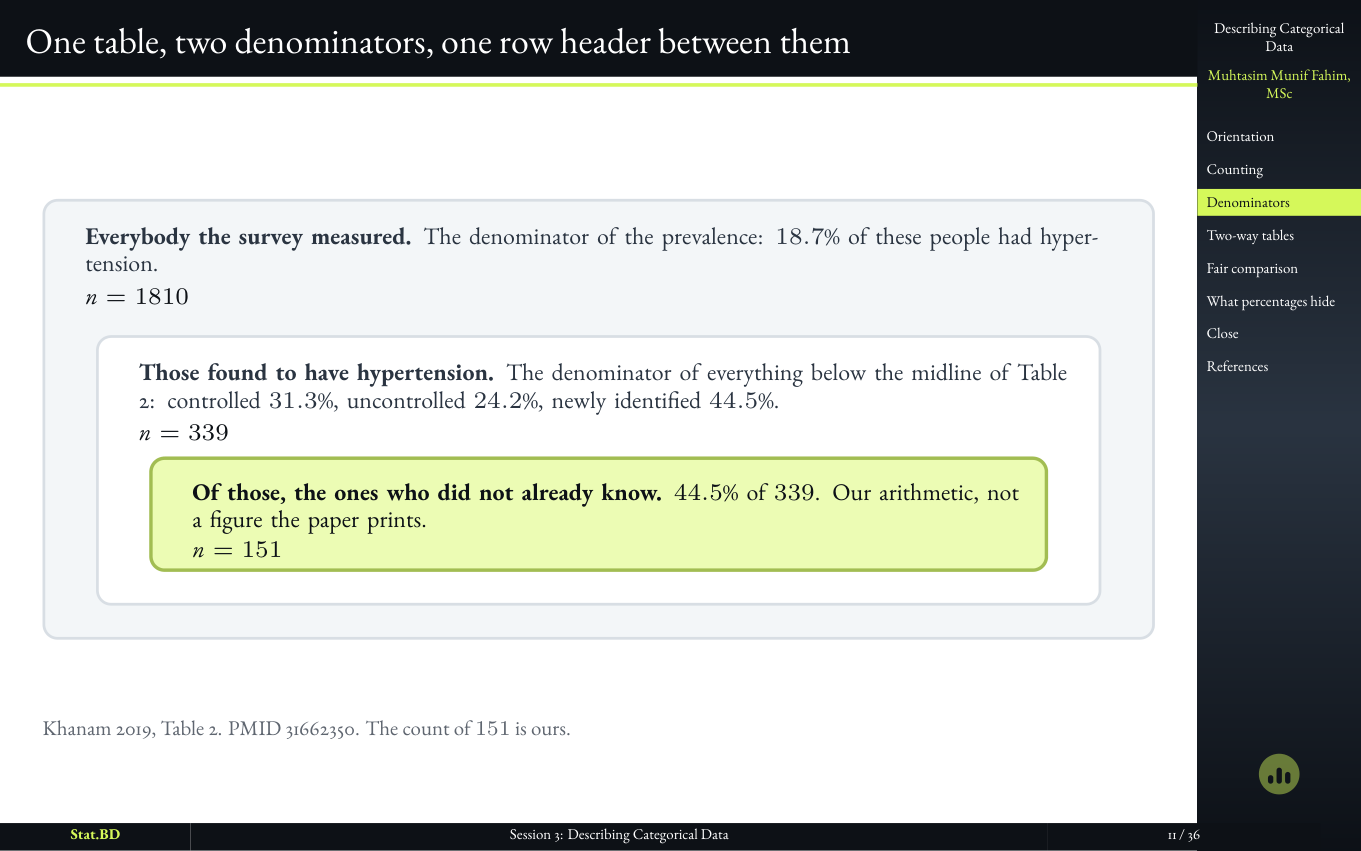
  2. Session 3, Act II · Out of how many? The question the number does not answer: One table, two denominators, one row header between them.

    Slide 11

    One table, two denominators, one row header between them

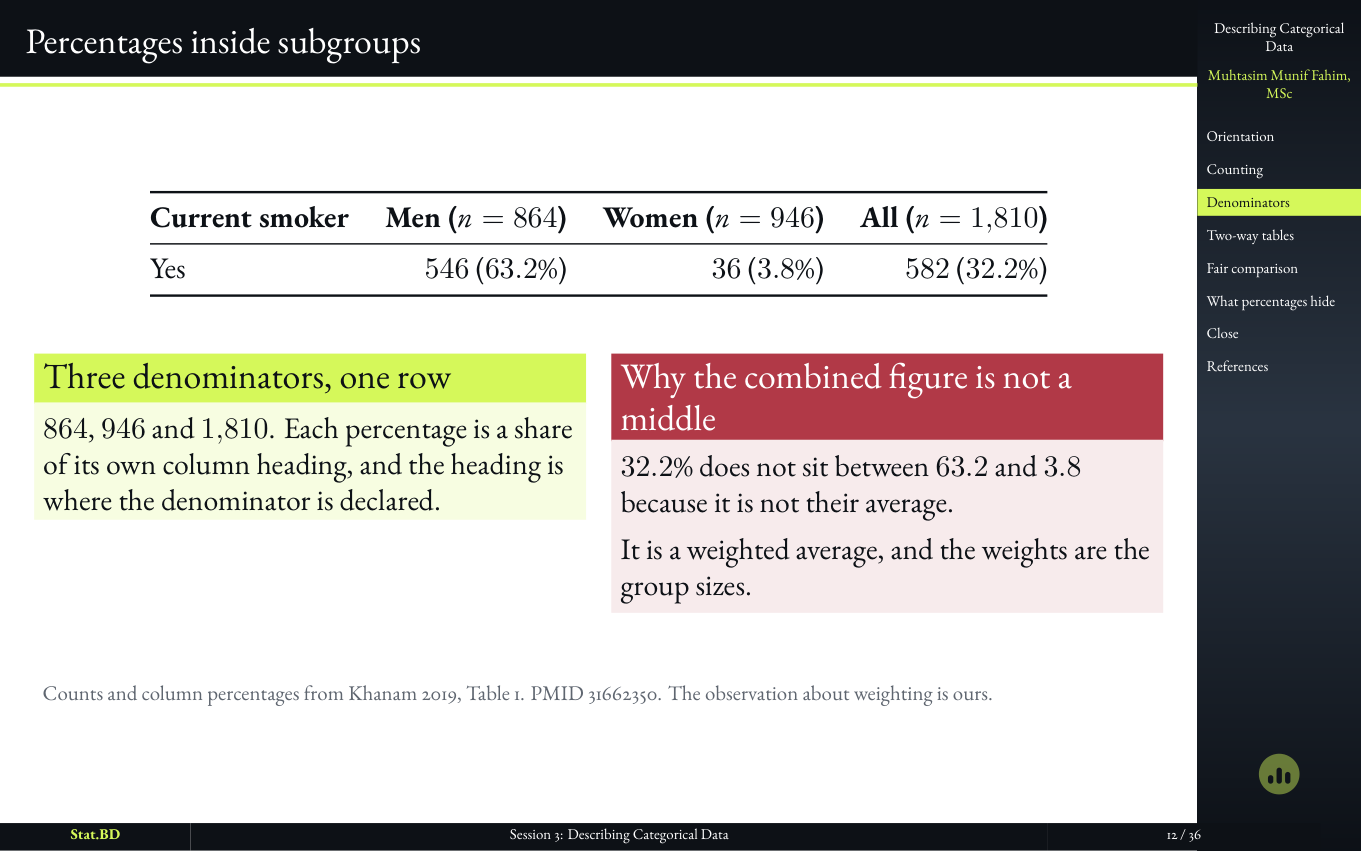
  3. Session 3, Act II · Out of how many? The question the number does not answer: Percentages inside subgroups.

    Slide 12

    Percentages inside subgroups

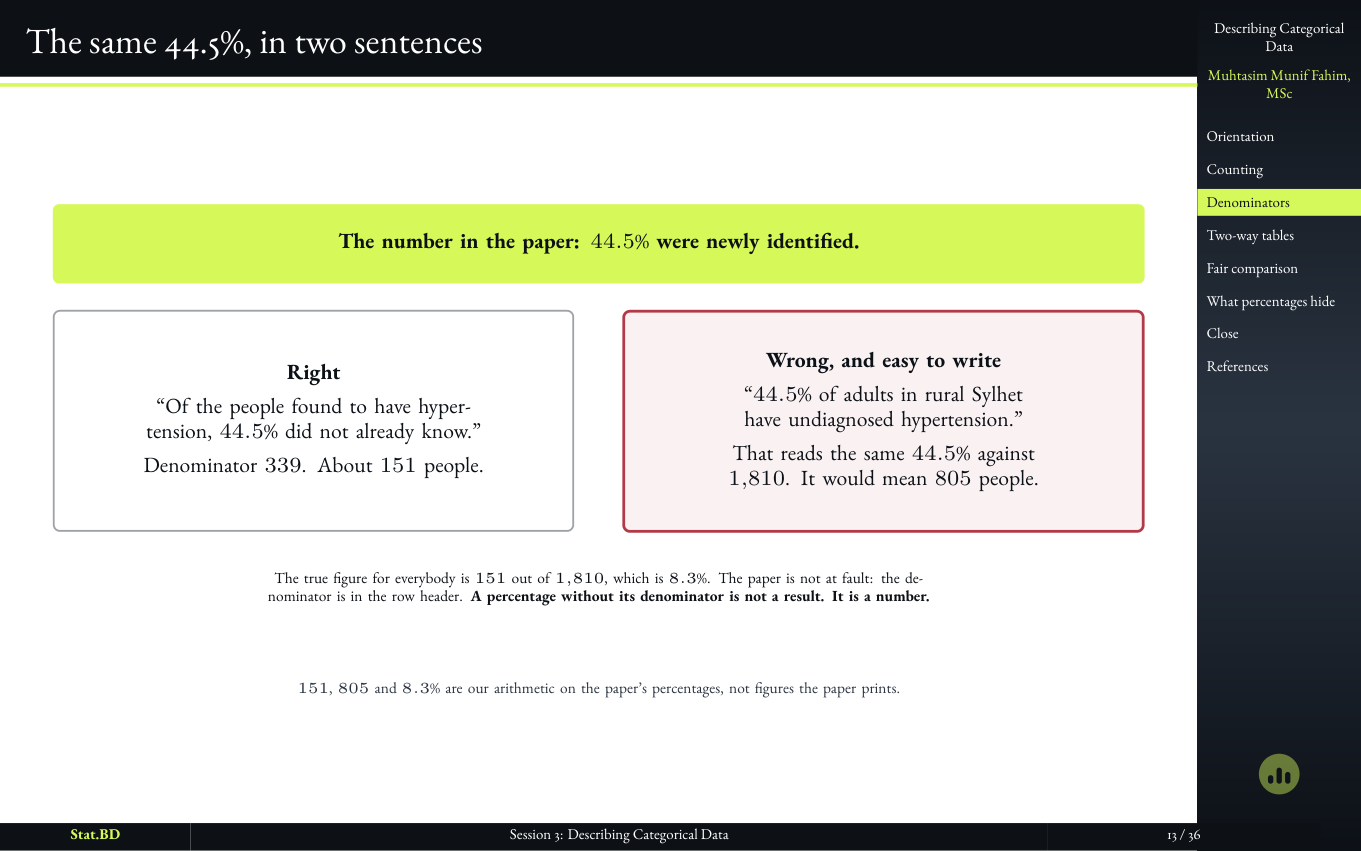
  4. Session 3, Act II · Out of how many? The question the number does not answer: The same 44.5%, in two sentences.

    Slide 13

    The same 44.5%, in two sentences

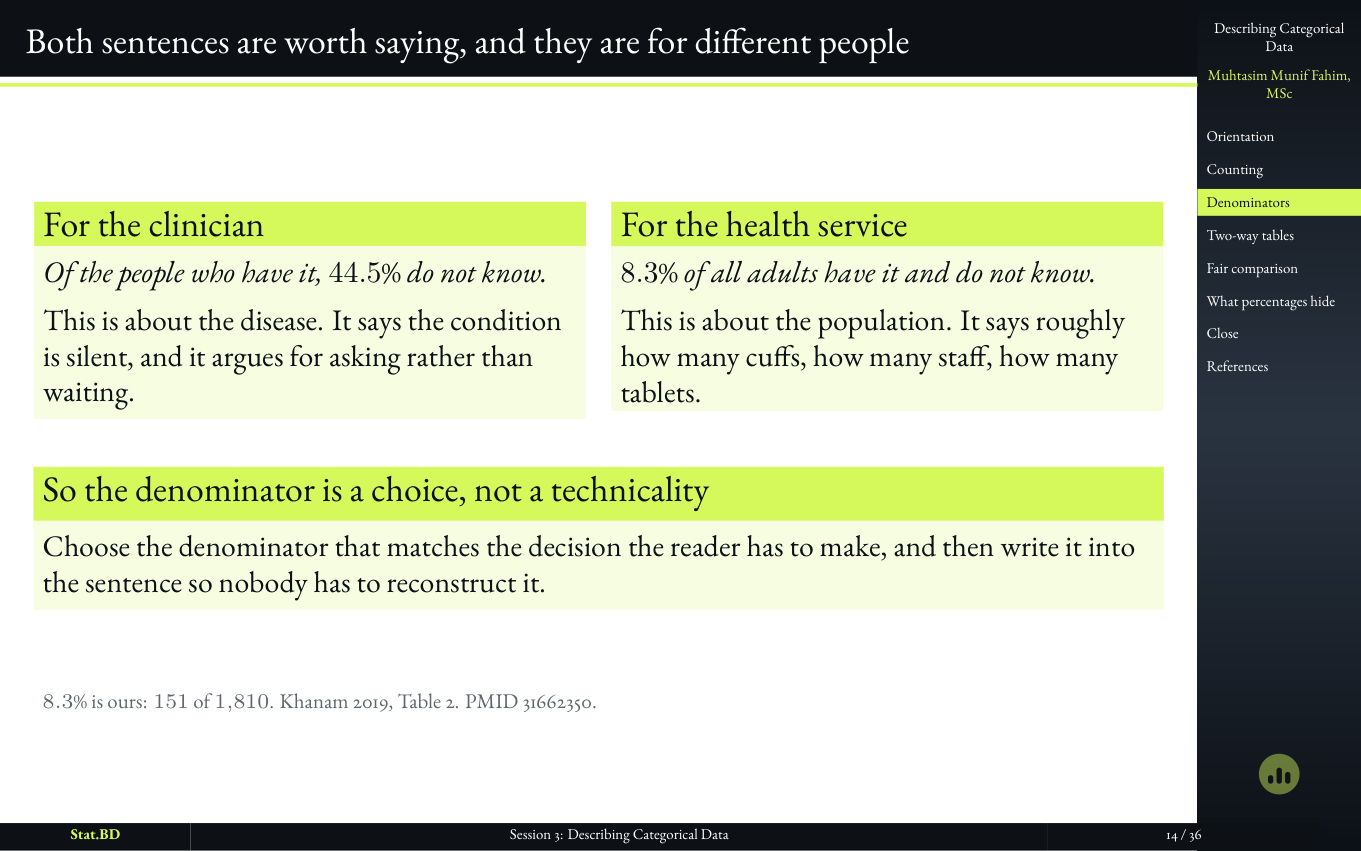
  5. Session 3, Act II · Out of how many? The question the number does not answer: Both sentences are worth saying, and they are for different people.

    Slide 14

    Both sentences are worth saying, and they are for different people

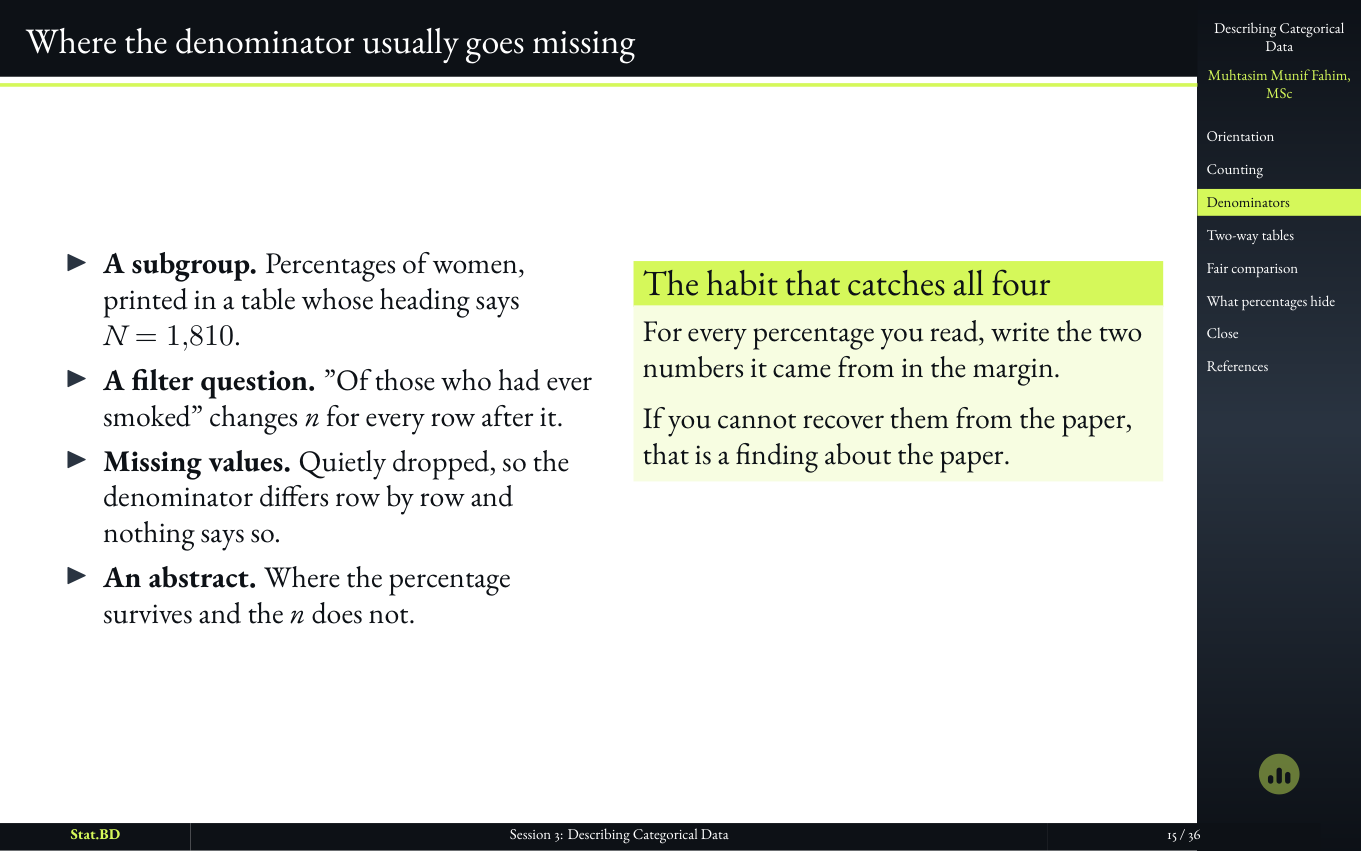
  6. Session 3, Act II · Out of how many? The question the number does not answer: Where the denominator usually goes missing.

    Slide 15

    Where the denominator usually goes missing

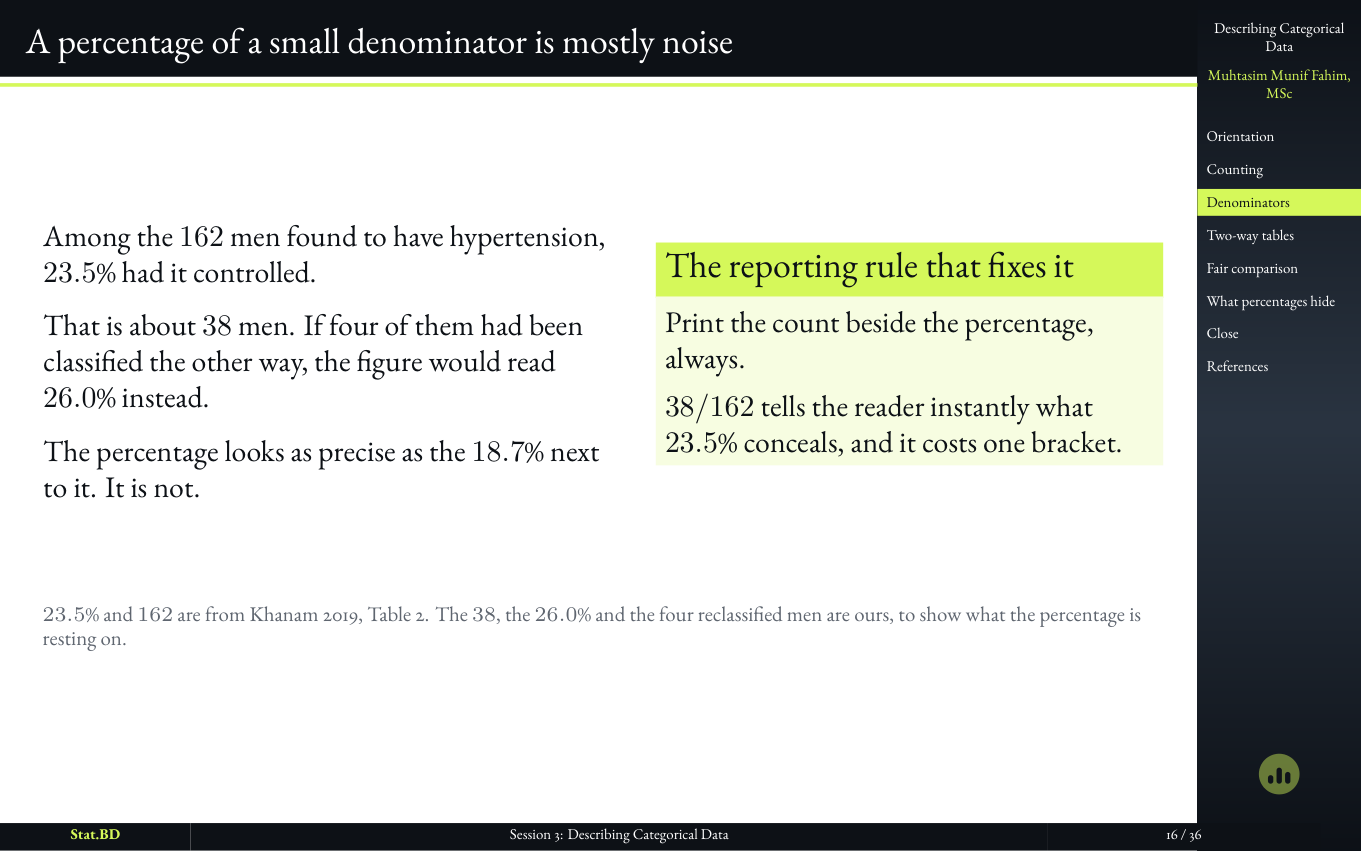
  7. Session 3, Act II · Out of how many? The question the number does not answer: A percentage of a small denominator is mostly noise.

    Slide 16

    A percentage of a small denominator is mostly noise

6 slides

Act III · Two Columns at Once, and the Three Percentages in Every Cell
  1. Session 3, Act III · Two columns at once, and the three percentages in every cell: Act III · Two columns at once, and the three percentages in every cell.

    Slide 17

    Act III · Two Columns at Once, and the Three Percentages in Every Cell
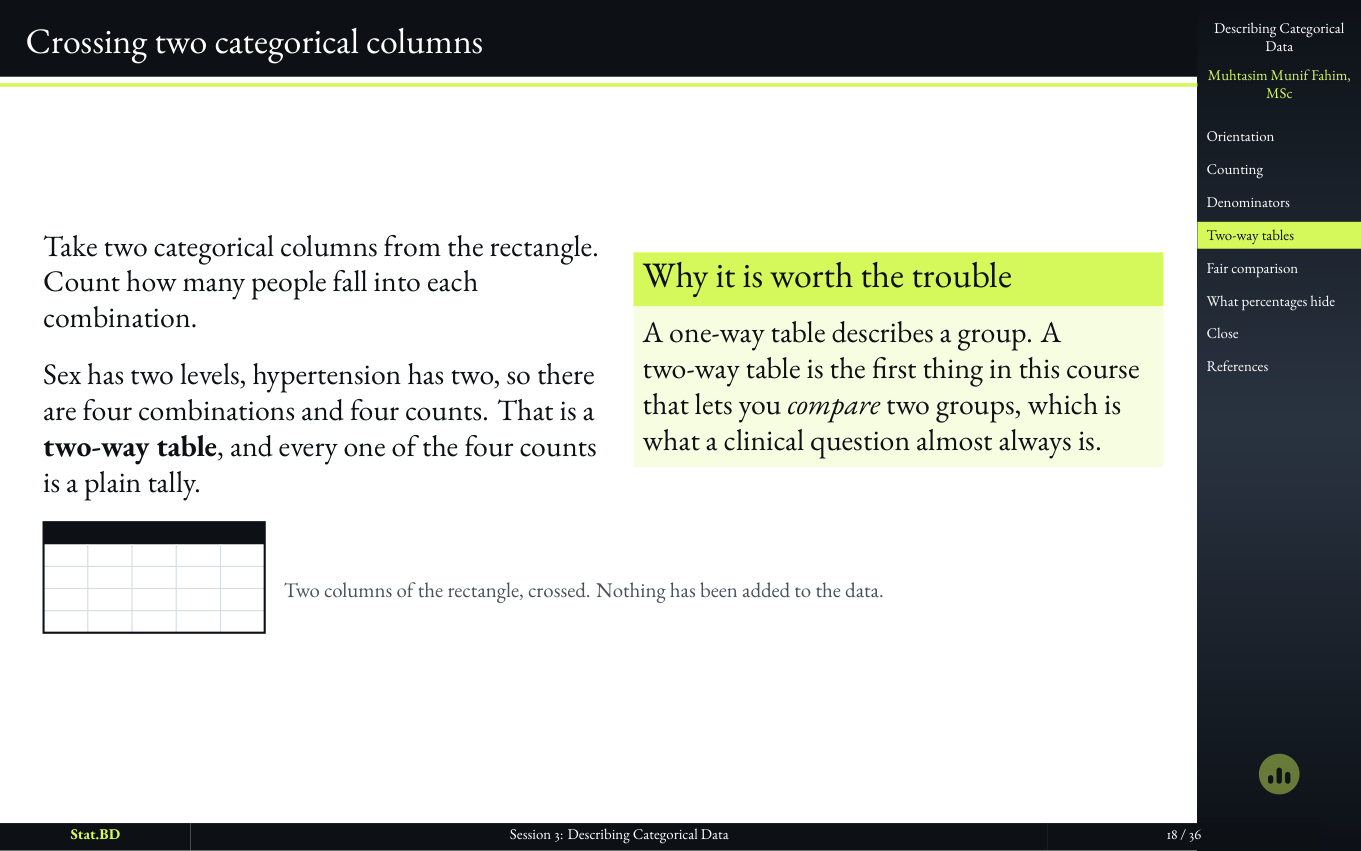
  2. Session 3, Act III · Two columns at once, and the three percentages in every cell: Crossing two categorical columns.

    Slide 18

    Crossing two categorical columns

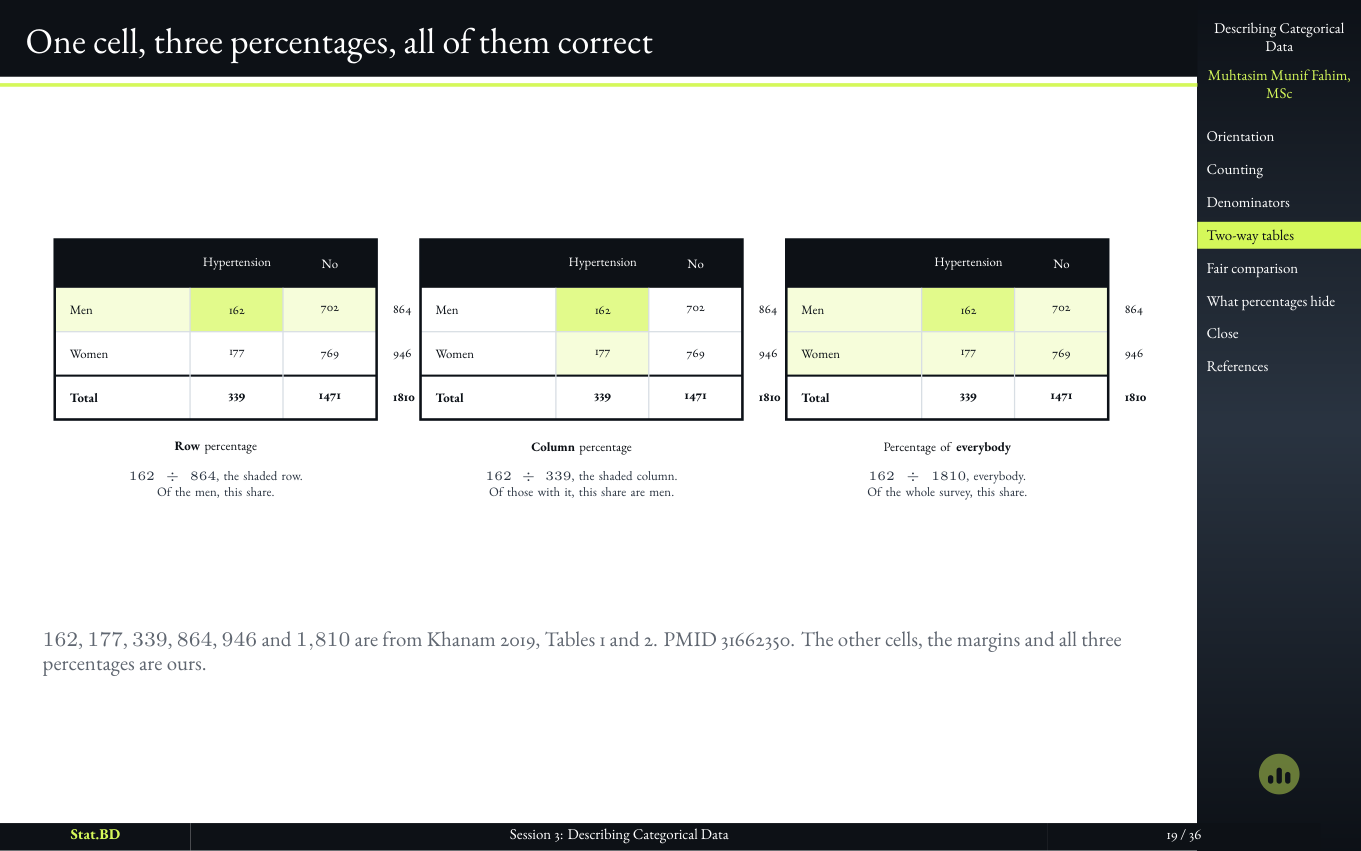
  3. Slide showing one cell of a two-way table expressed as three different correct percentages.

    Slide 19

    One cell, three percentages, all of them correct

    Row, column, and overall: three different denominators, three true percentages, three different sentences. The question is never ‘which number is right?’ It is ‘which sentence were you trying to say?’

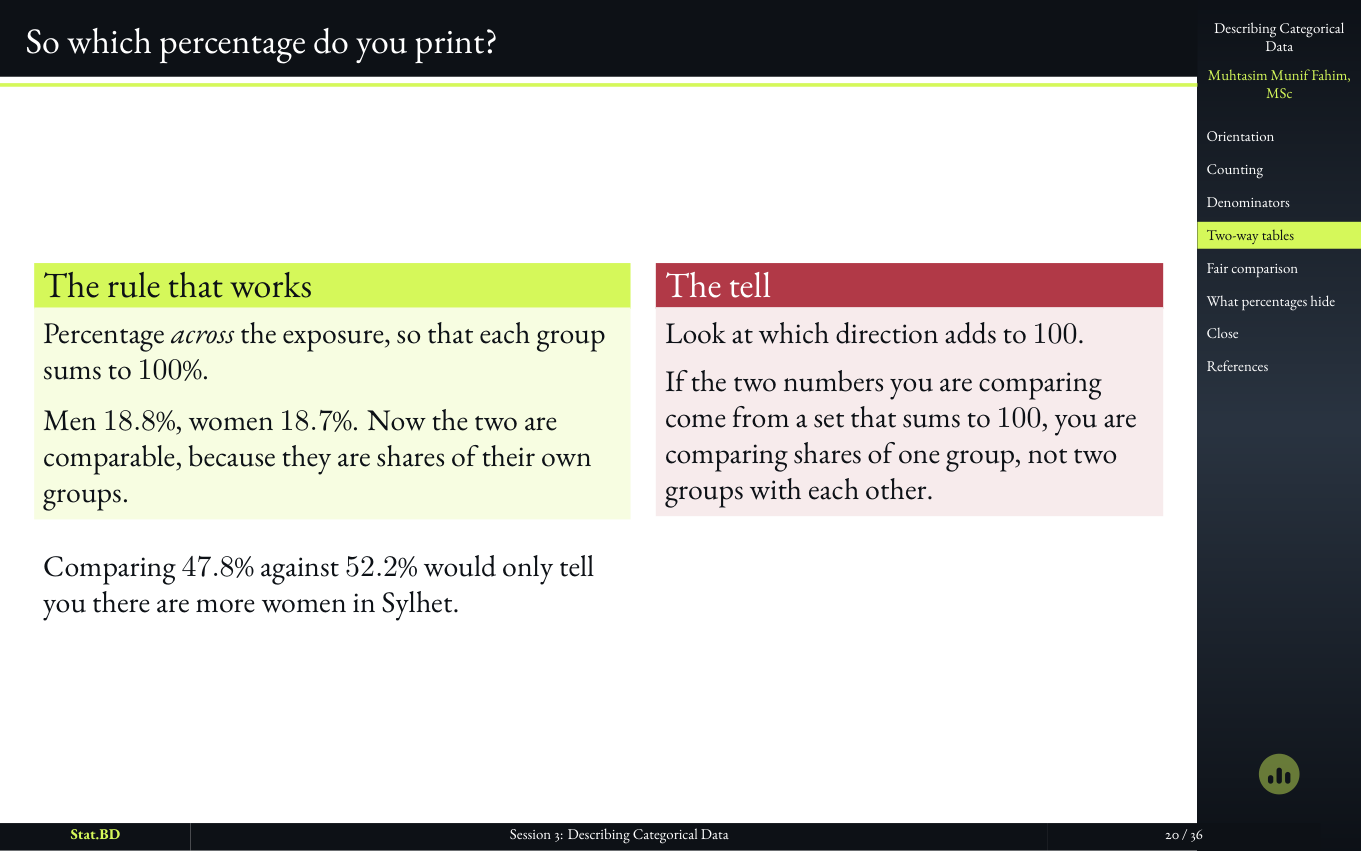
  4. Session 3, Act III · Two columns at once, and the three percentages in every cell: So which percentage do you print?.

    Slide 20

    So which percentage do you print?

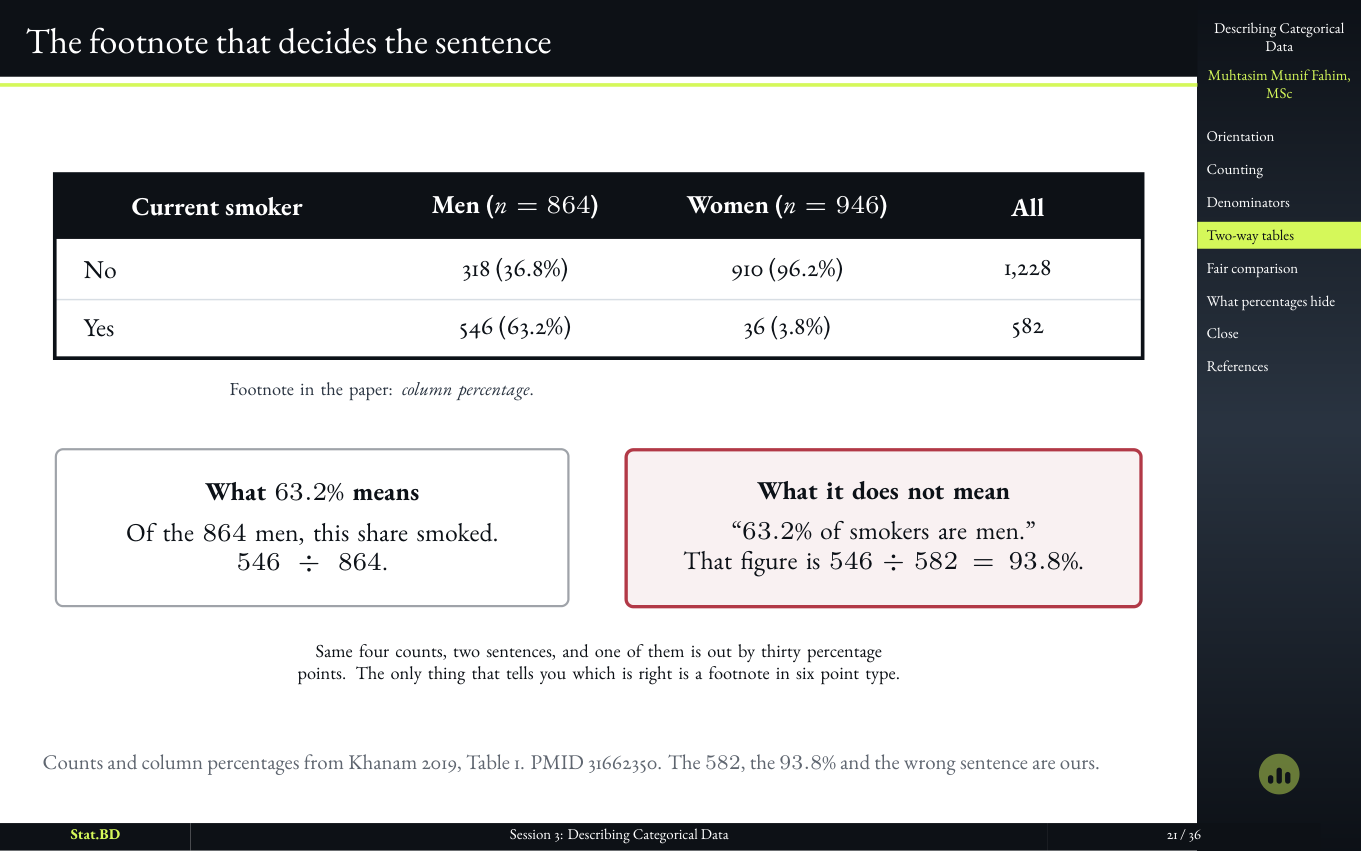
  5. Session 3, Act III · Two columns at once, and the three percentages in every cell: The footnote that decides the sentence.

    Slide 21

    The footnote that decides the sentence

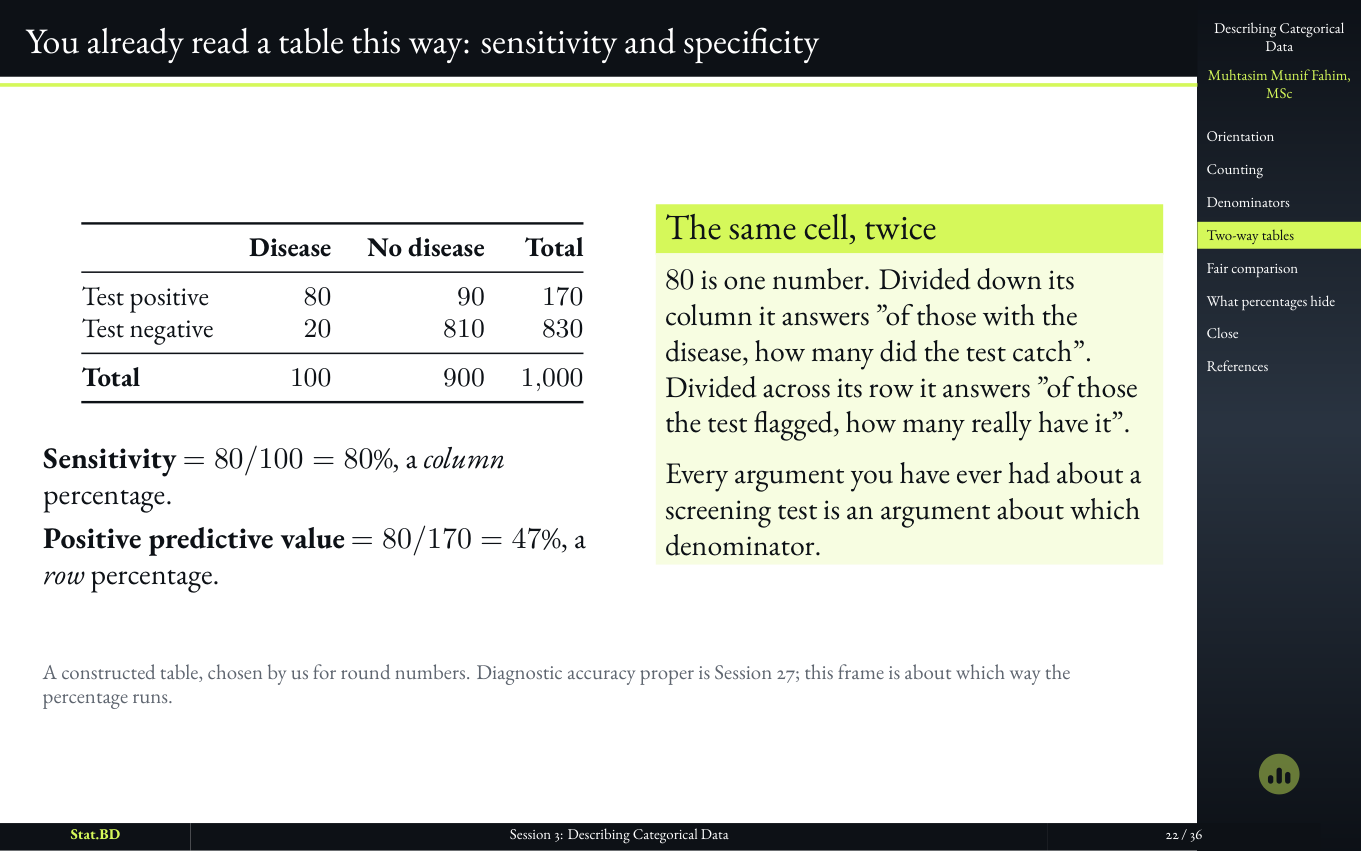
  6. Session 3, Act III · Two columns at once, and the three percentages in every cell: You already read a table this way: sensitivity and specificity.

    Slide 22

    You already read a table this way: sensitivity and specificity

6 slides

Act IV · When the Comparison Is Not a Fair One
  1. Session 3, Act IV · When the comparison is not a fair one: Act IV · When the comparison is not a fair one.

    Slide 23

    Act IV · When the Comparison Is Not a Fair One
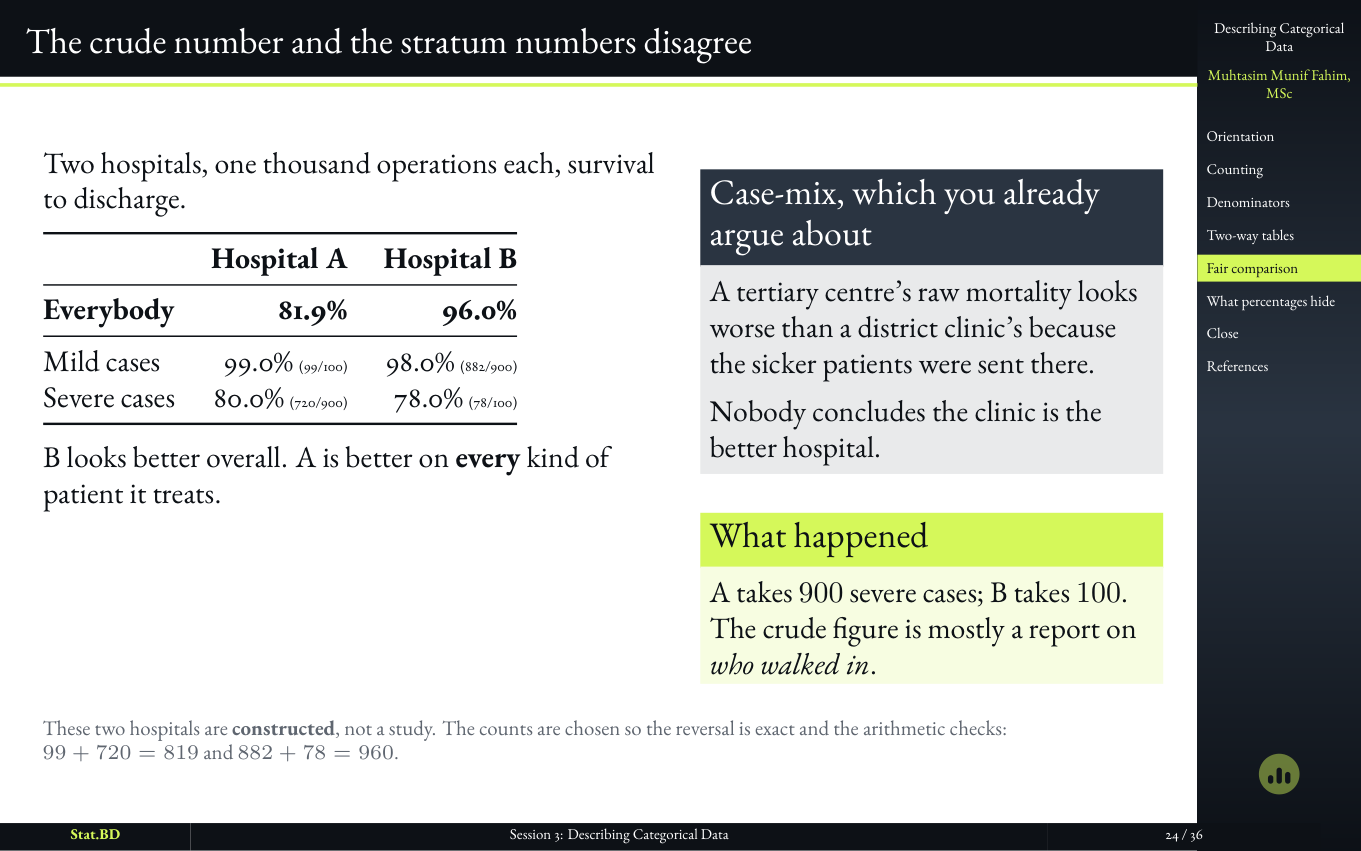
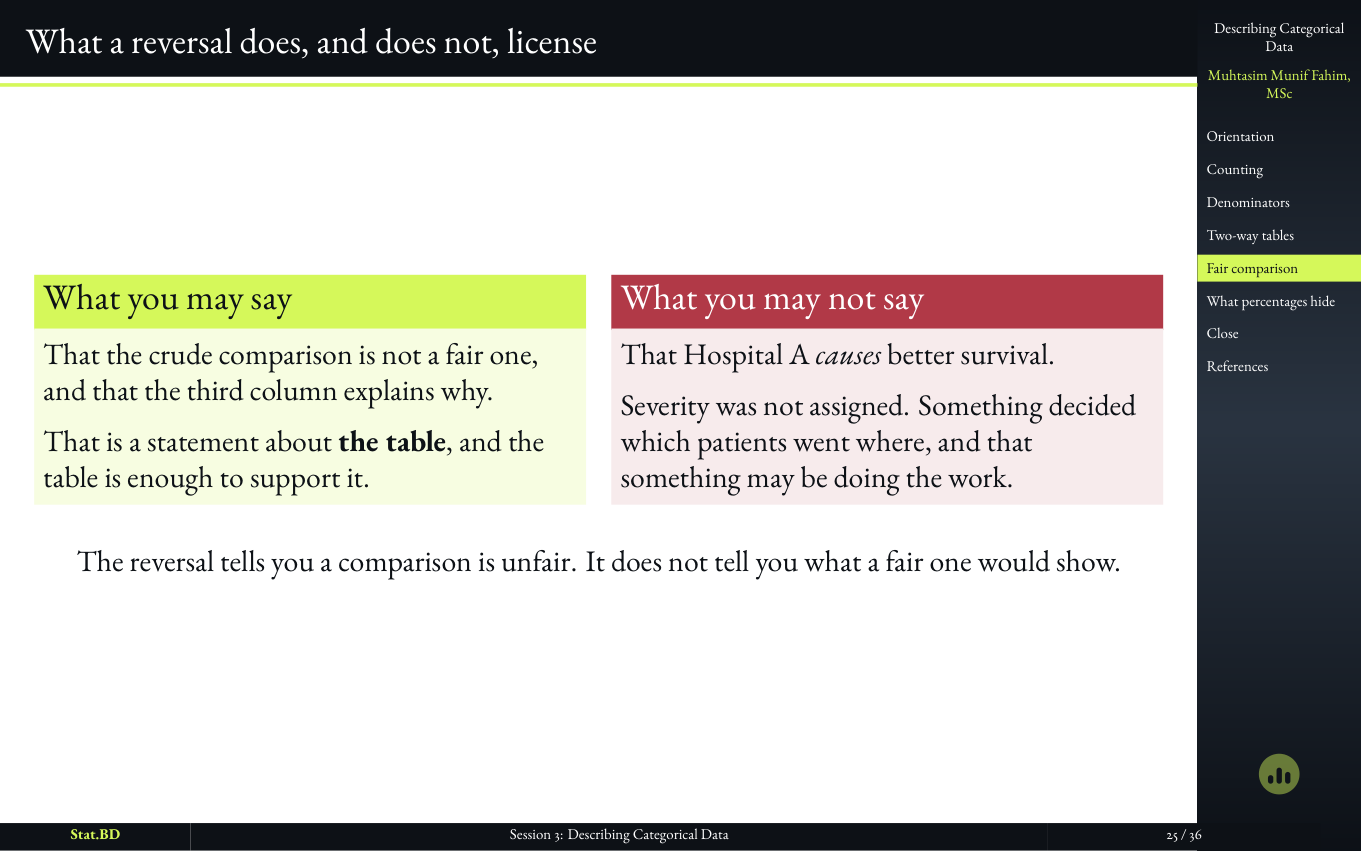
  2. Slide showing crude hospital mortality figures that reverse after case-mix is taken into account.

    Slide 24

    The crude number and the stratum numbers disagree

    Hospital A looks safer until you notice who was sent there. A crude percentage can reverse once the same patients are compared inside the same stratum. That is not a trick. It is why a Table 1 is read before a headline.

  3. Session 3, Act IV · When the comparison is not a fair one: What a reversal does, and does not, license.

    Slide 25

    What a reversal does, and does not, license

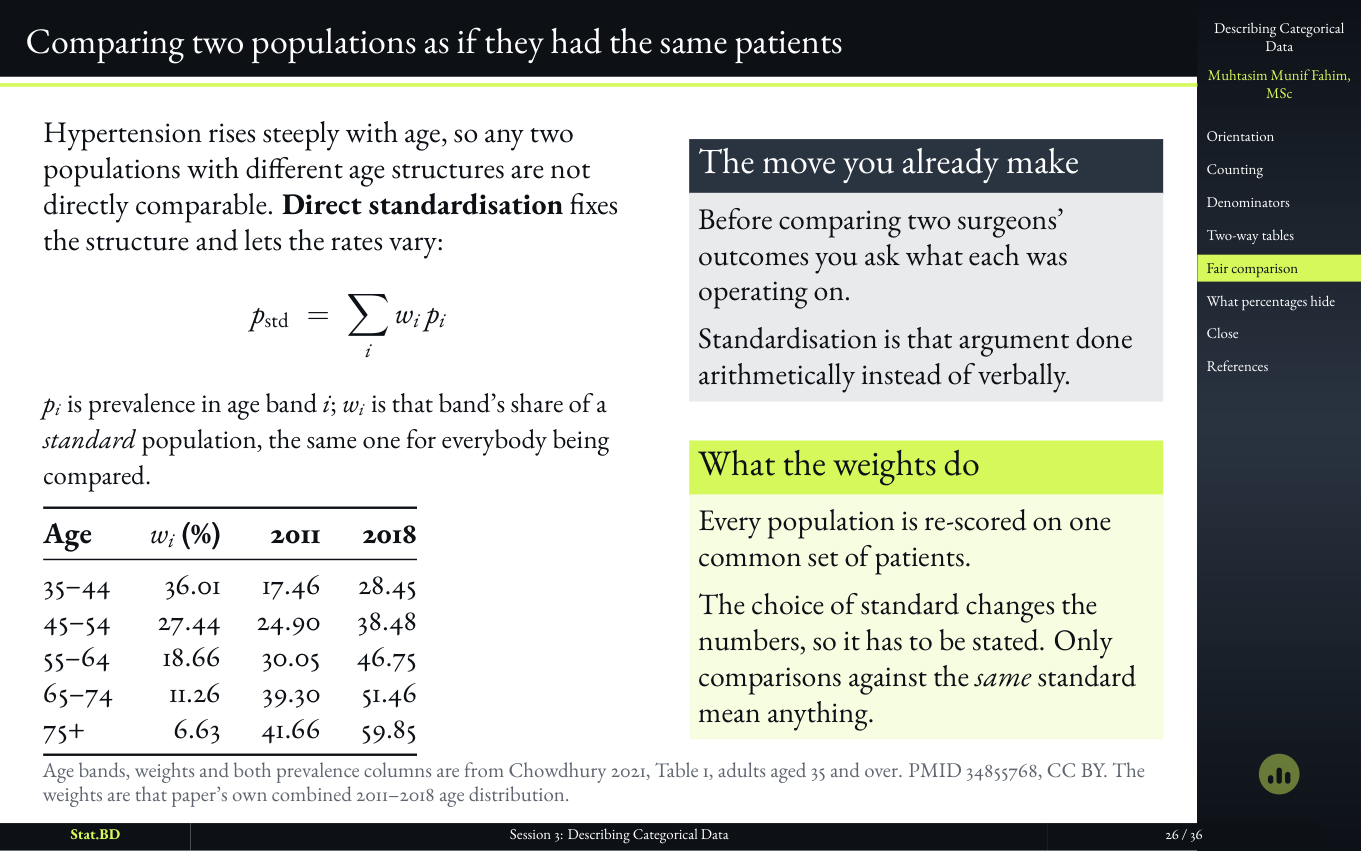
  4. Slide introducing direct standardization as comparing two populations as if they had the same patients.

    Slide 26

    Comparing two populations as if they had the same patients

    Standardization is not advanced material smuggled into description. It is the move that lets two percentages talk to each other when the people underneath them are not the same mix.

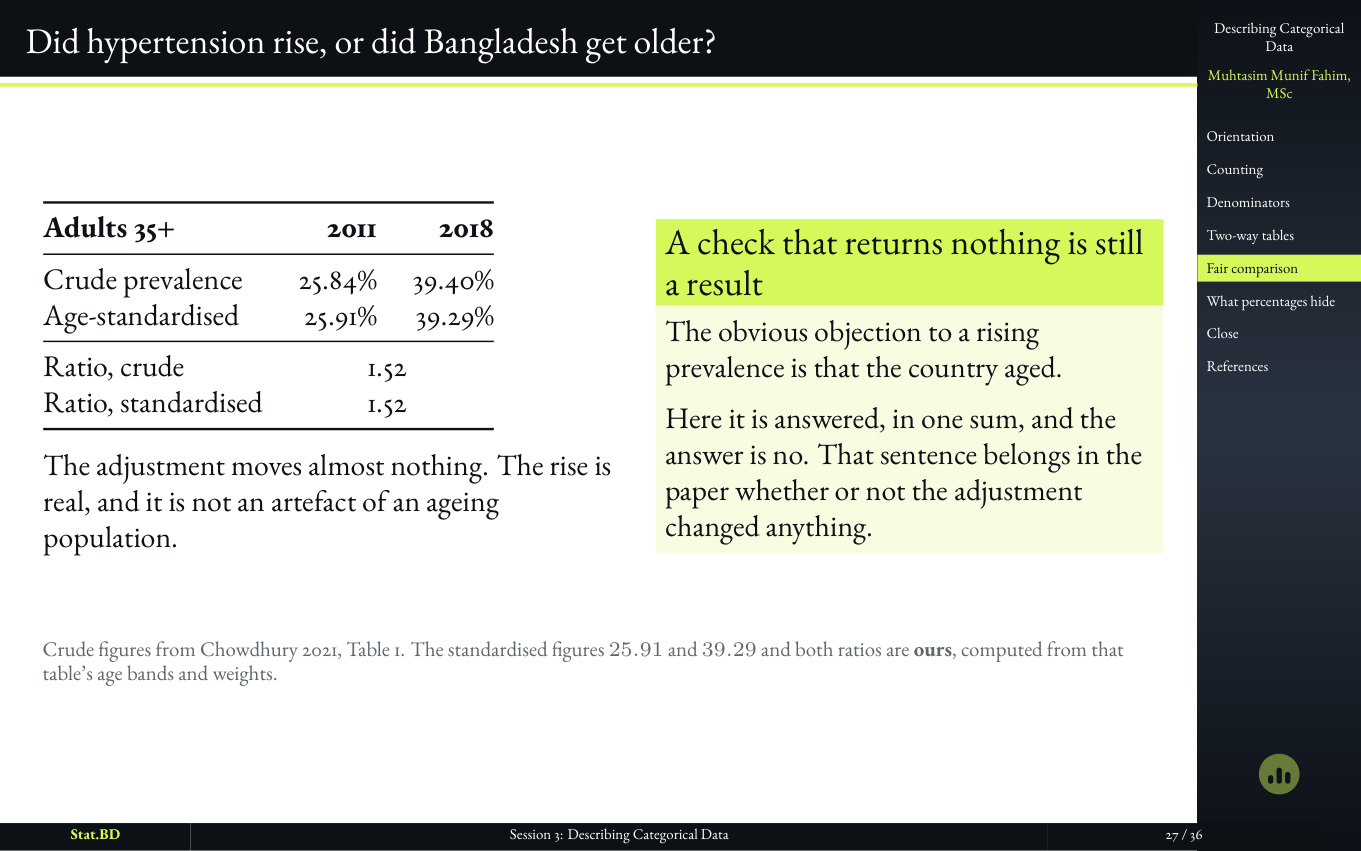
  5. Slide asking whether hypertension rose in Bangladesh or whether the population got older.

    Slide 27

    Did hypertension rise, or did Bangladesh get older?

    The crude figures move. The obvious objection is age. The session answers it in one sum, with the standardized figures computed in the room, so a rising headline has to survive a fairer comparison.

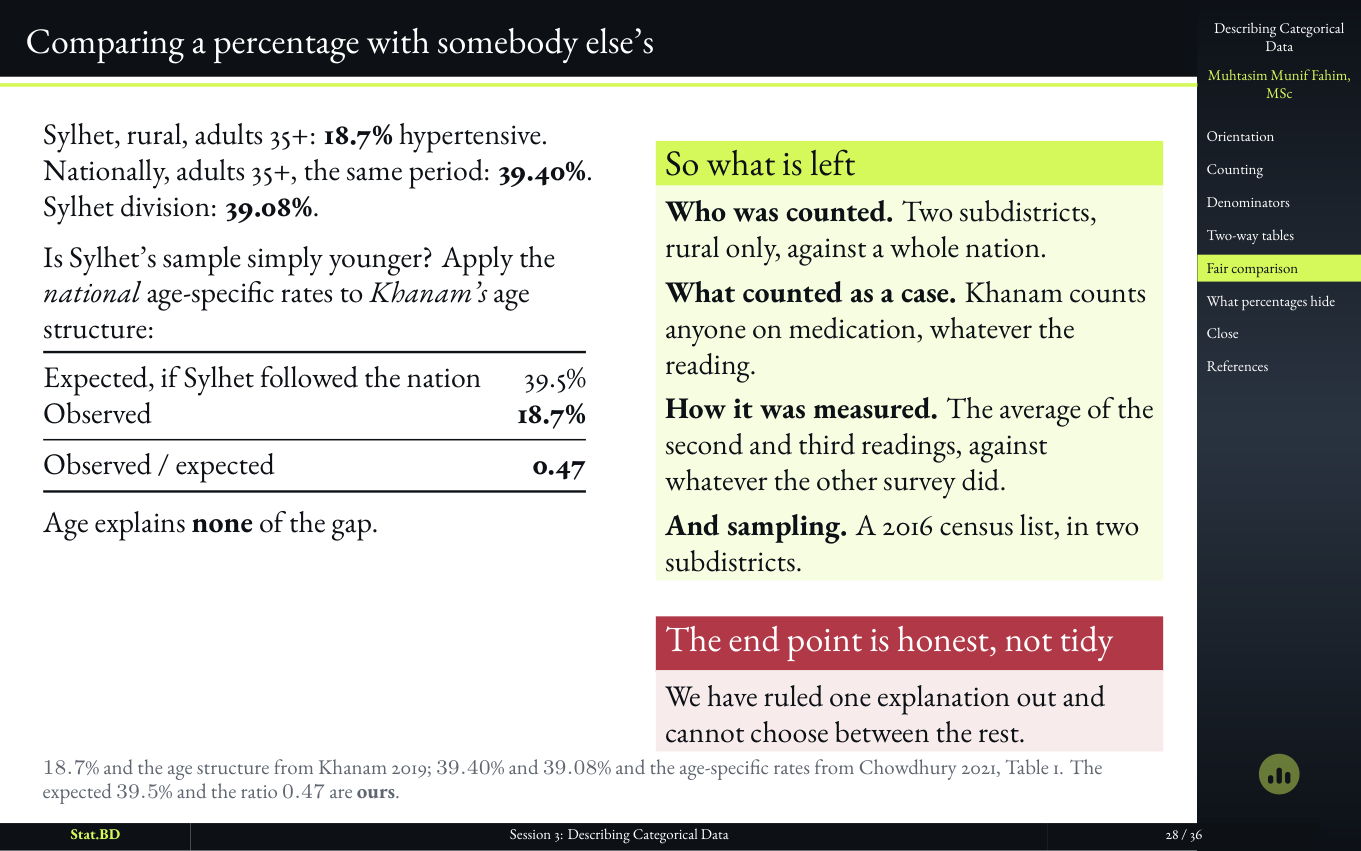
  6. Session 3, Act IV · When the comparison is not a fair one: Comparing a percentage with somebody else’s.

    Slide 28

    Comparing a percentage with somebody else’s

6 slides

Act V · What a Percentage Hides, and How to Check
  1. Session 3, Act V · What a percentage hides, and how to check: Act V · What a percentage hides, and how to check.

    Slide 29

    Act V · What a Percentage Hides, and How to Check
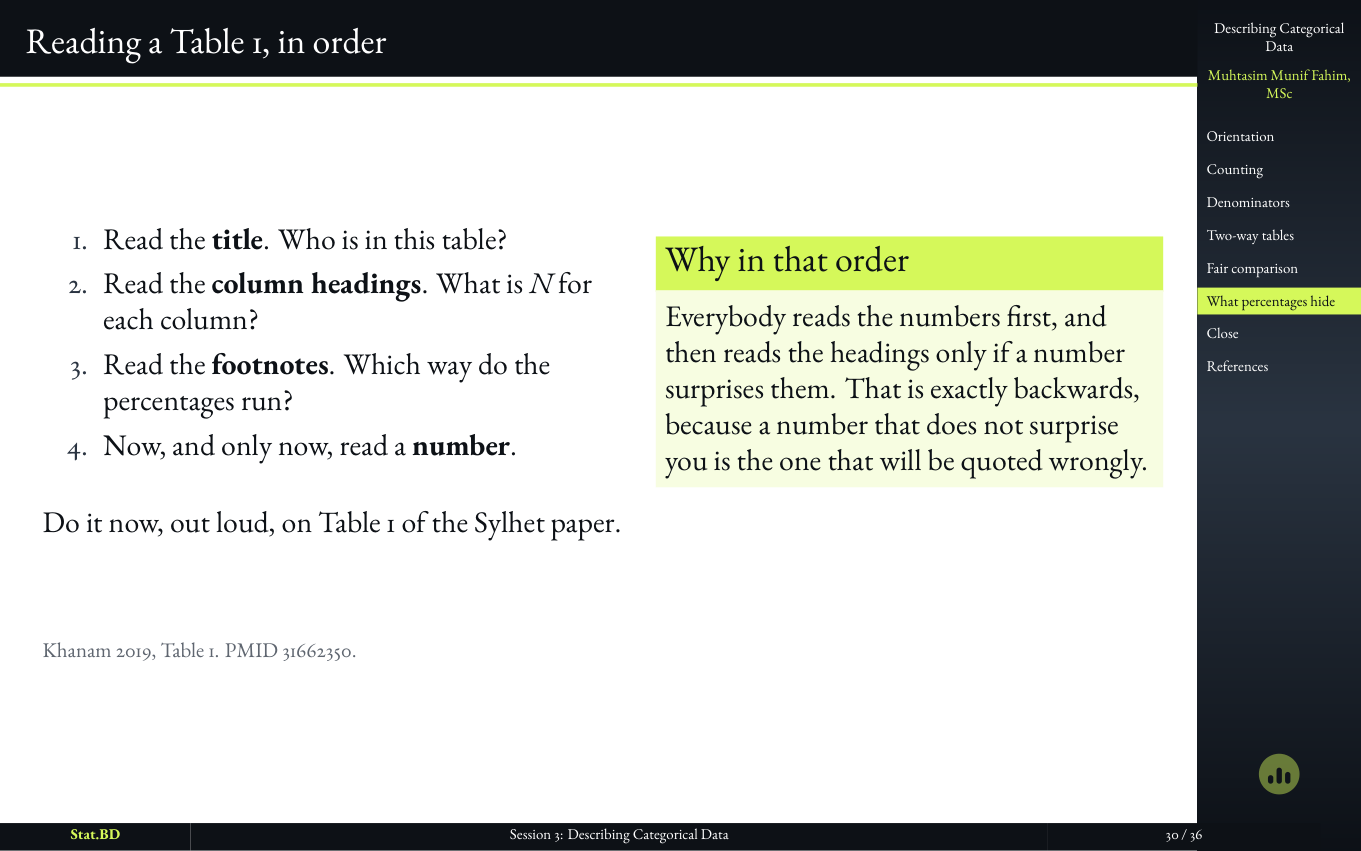
  2. Session 3, Act V · What a percentage hides, and how to check: Reading a Table 1, in order.

    Slide 30

    Reading a Table 1, in order

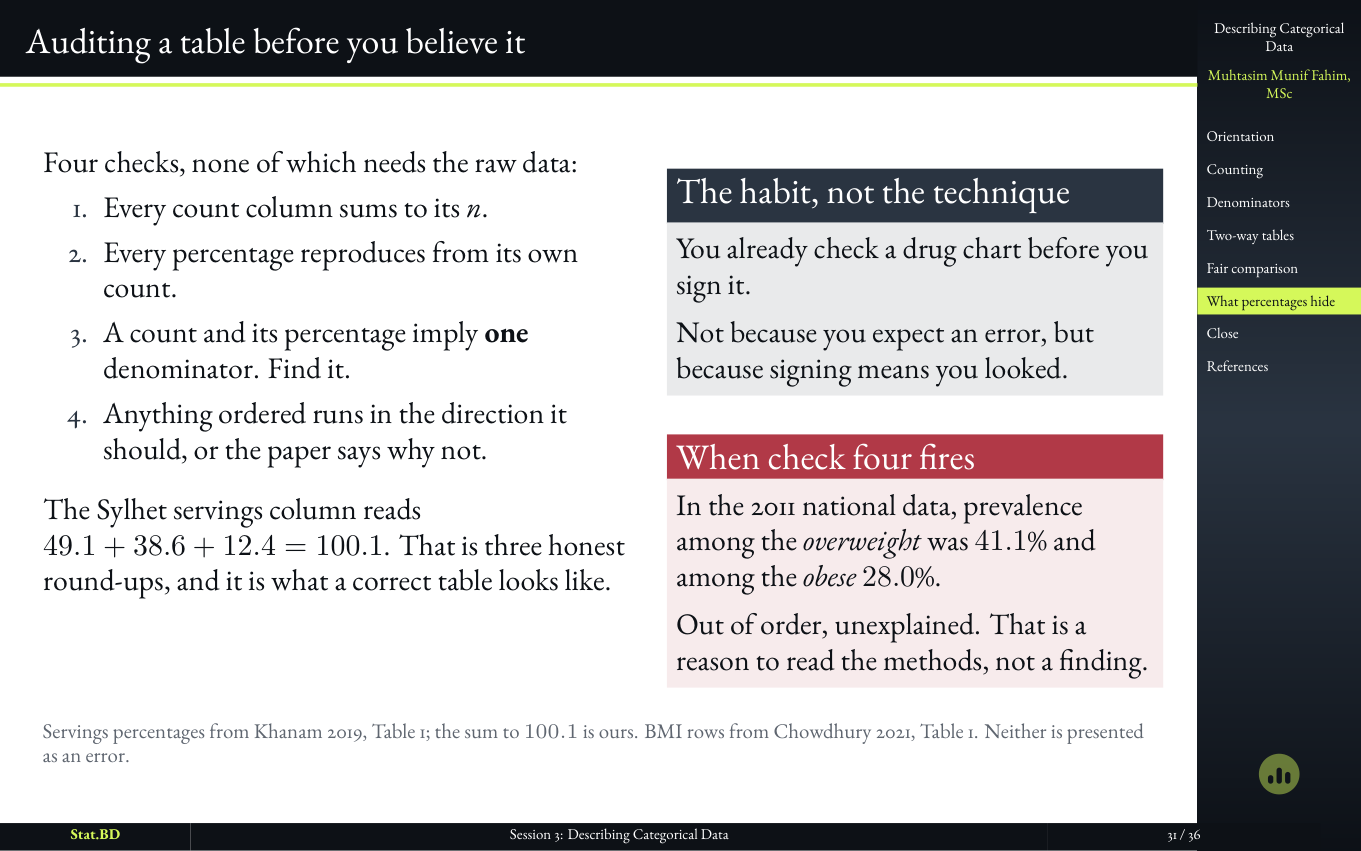
  3. Session 3, Act V · What a percentage hides, and how to check: Auditing a table before you believe it.

    Slide 31

    Auditing a table before you believe it

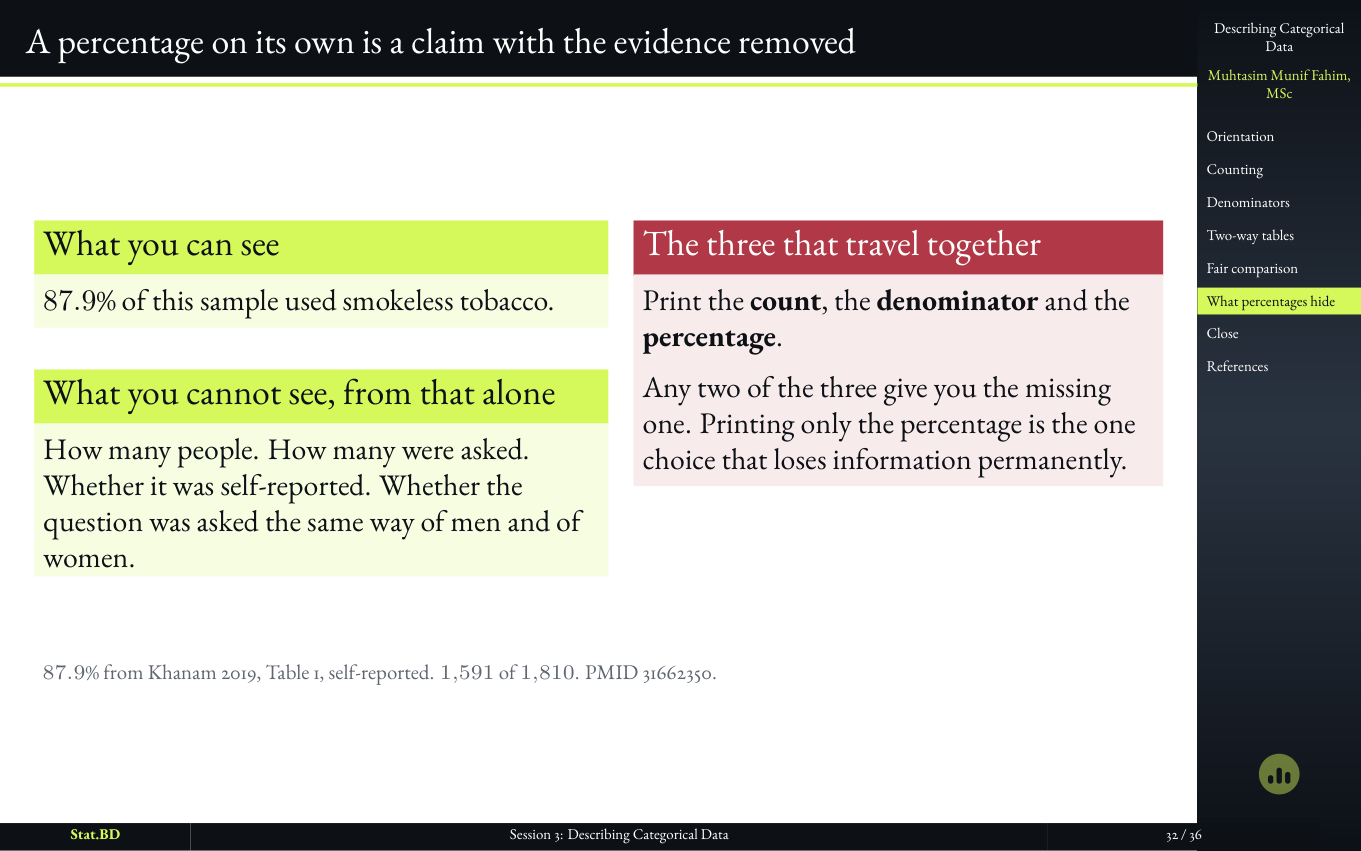
  4. Slide stating that a percentage on its own is a claim with the evidence removed.

    Slide 32

    A percentage on its own is a claim with the evidence removed

    The session closes on a habit, not a formula. If the denominator is not in the sentence, the number is not finished. That habit is what Session 3.5 then makes you produce yourself.

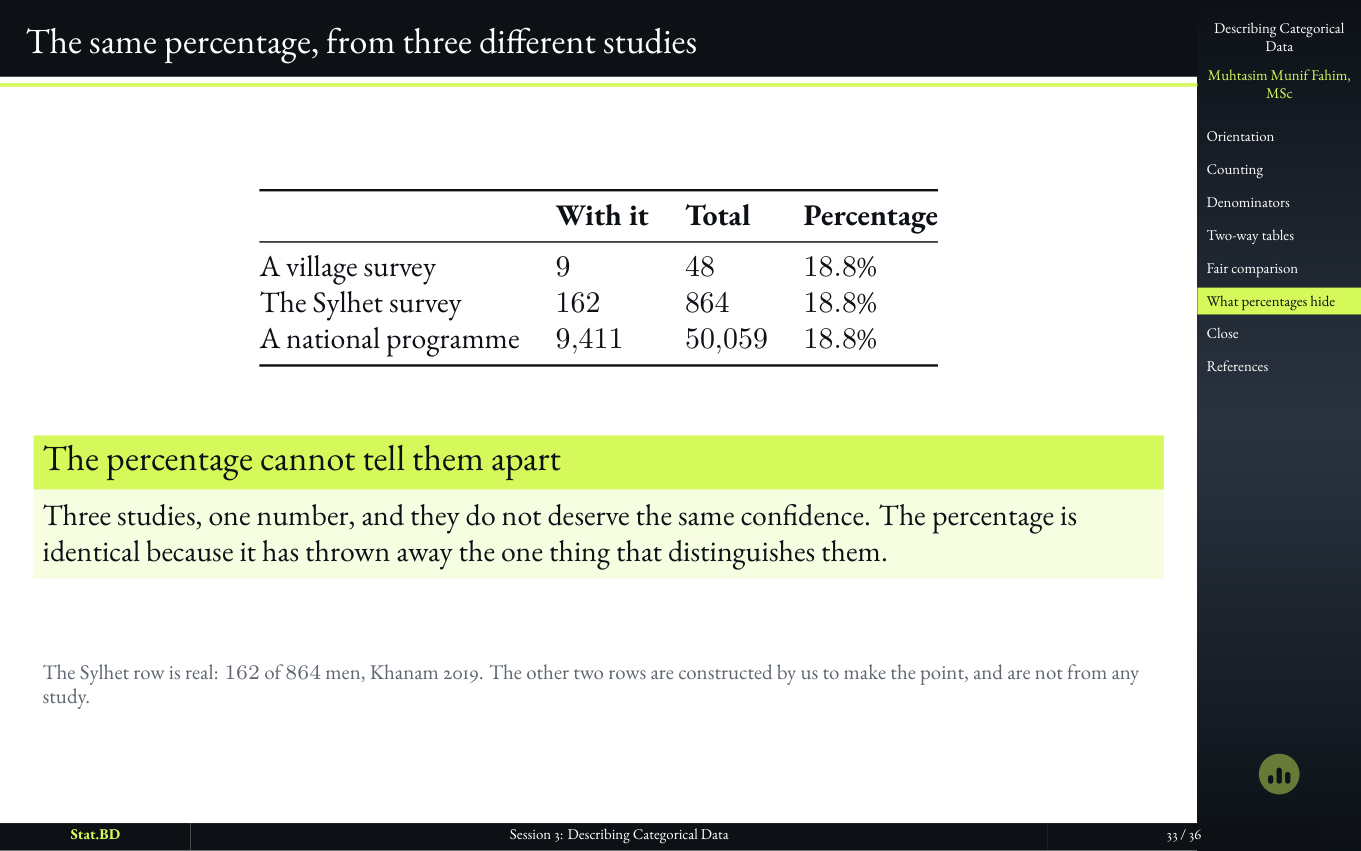
  5. Session 3, Act V · What a percentage hides, and how to check: The same percentage, from three different studies.

    Slide 33

    The same percentage, from three different studies

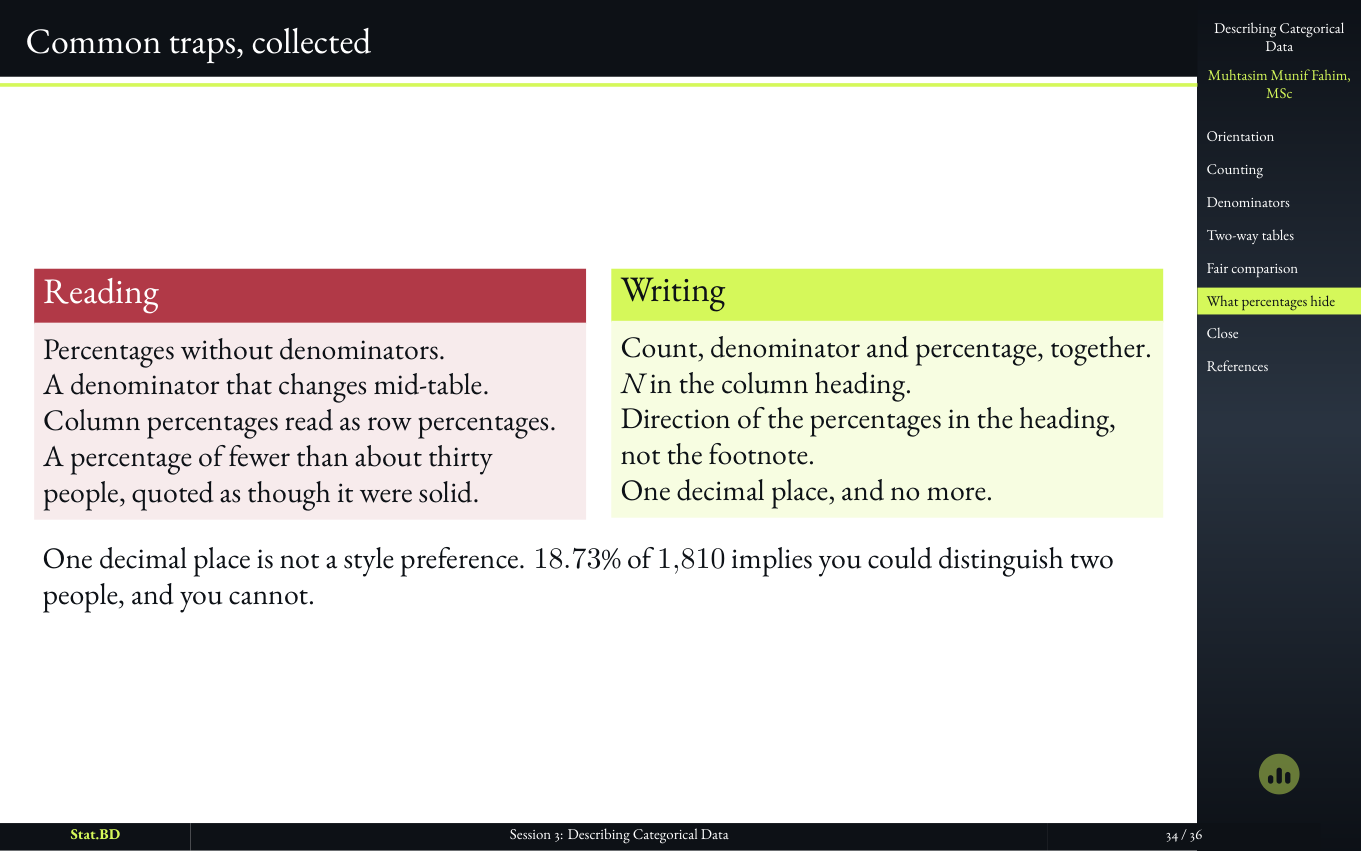
  6. Session 3, Act V · What a percentage hides, and how to check: Common traps, collected.

    Slide 34

    Common traps, collected

2 slides

Close

  1. Session 3, Close: Close.

    Slide 35

    Close

  2. Session 3, Close: Before the next session.

    Slide 36

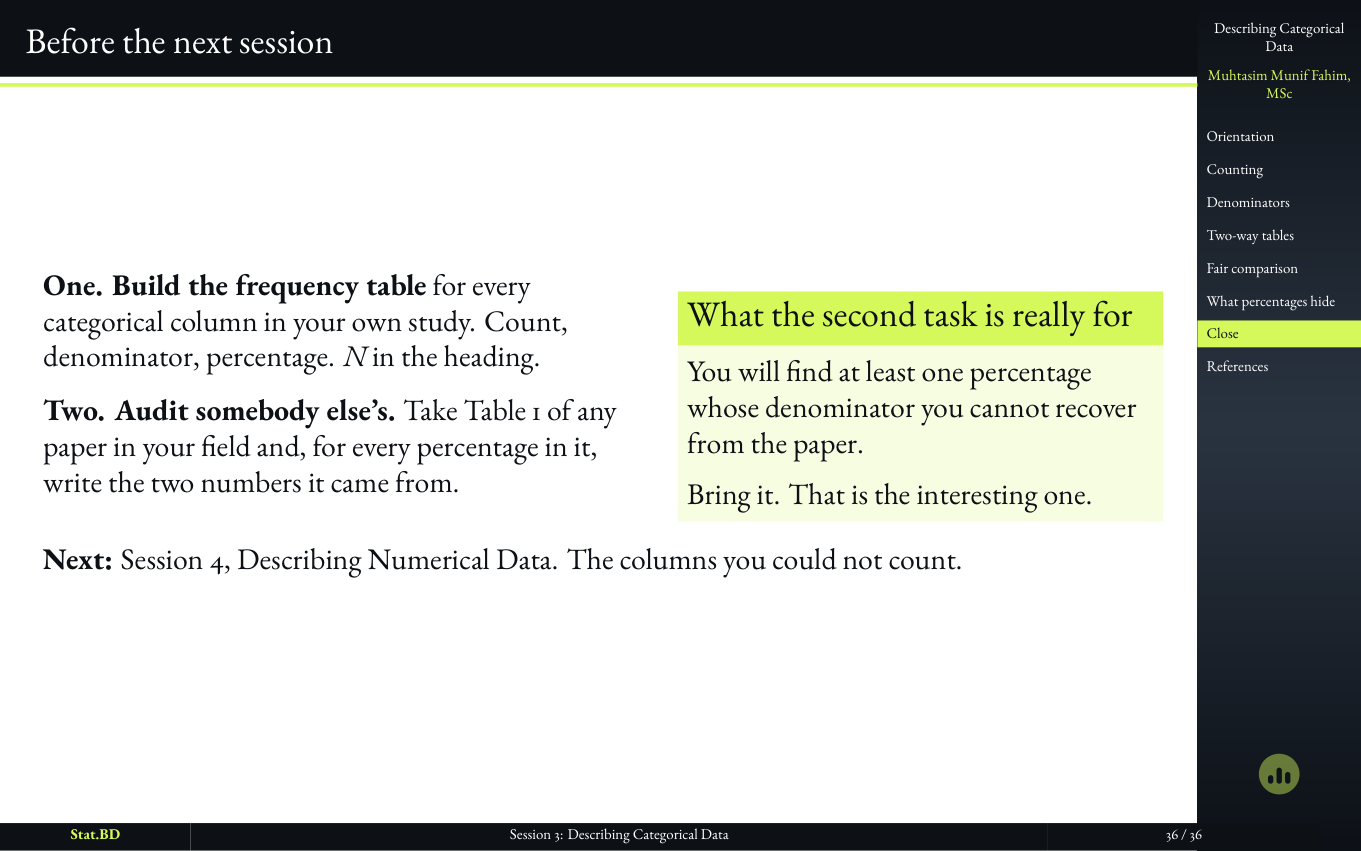
    Before the next session

Named and stopped

What We Deliberately Did Not Teach Yet.

  • How a numerical column is summarized (Session 4).
  • When a percentage difference becomes an effect measure (Phase III).
  • Meta-analysis of published percentages (Session 29).

Next session

Session 3.5: Working With Data in Excel

The next class is already up. Or request a plan built around your own question.